Cost Transparency
Latest Releases
-
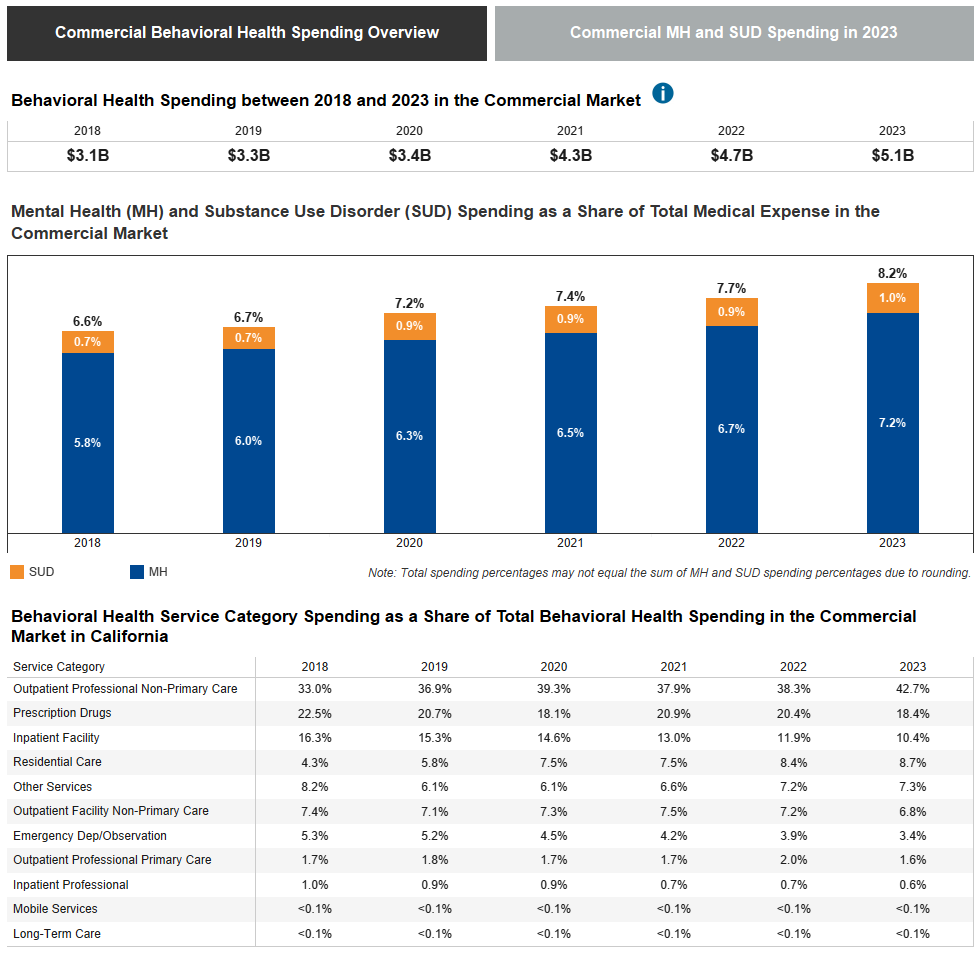 Data Brief: Behavioral Health Spending in California’s Commercial Market
A visualization looking into California's statewide spending on behavioral health services from 2018 through 2023.
-
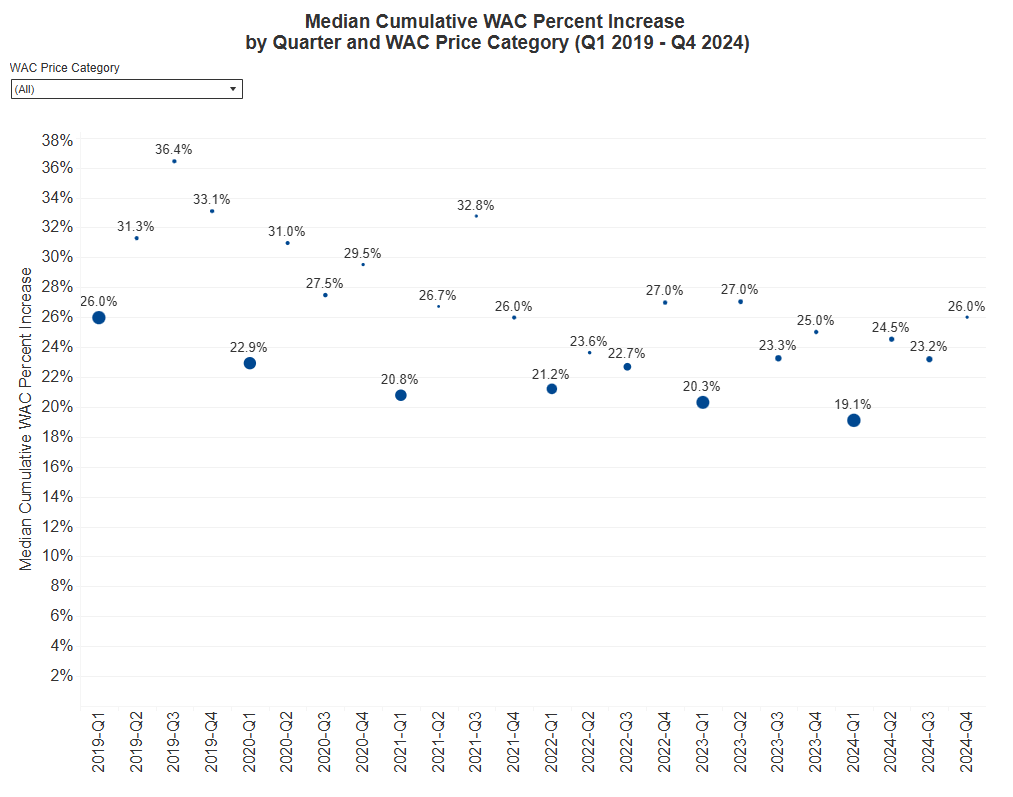 Wholesale Acquisition Cost (WAC) Increase Report Data – Cumulative
The interactive reports include submitted WAC increase data from quarter 1 (Q1) 2019 through quarter 4 (Q4) 2024.
-
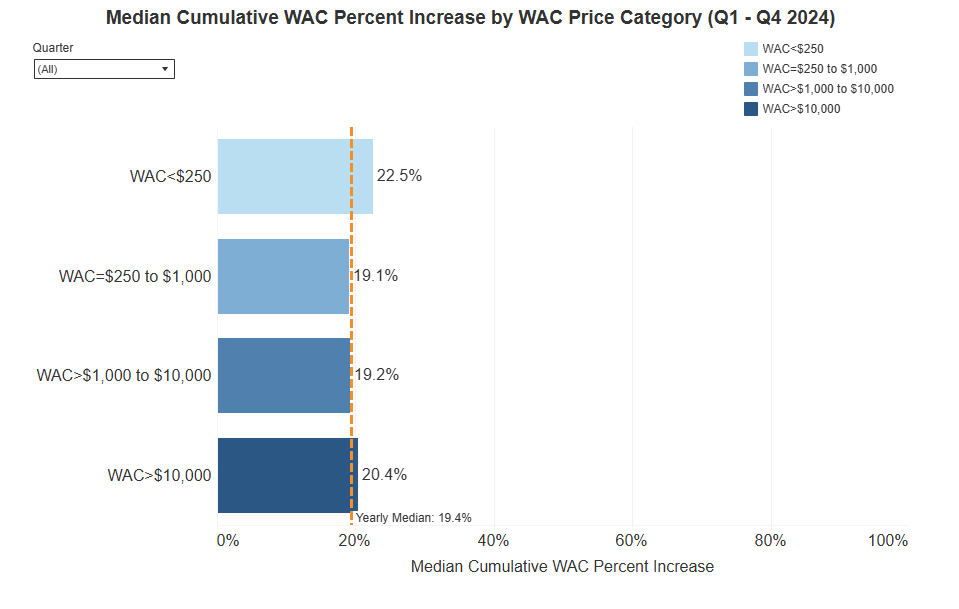 Wholesale Acquisition Cost (WAC) Increase Report Data – Current Year
Interactive reports showing Median Cumulative WAC Percent Increase by WAC Price Category, Drug Source Type, or both.
-
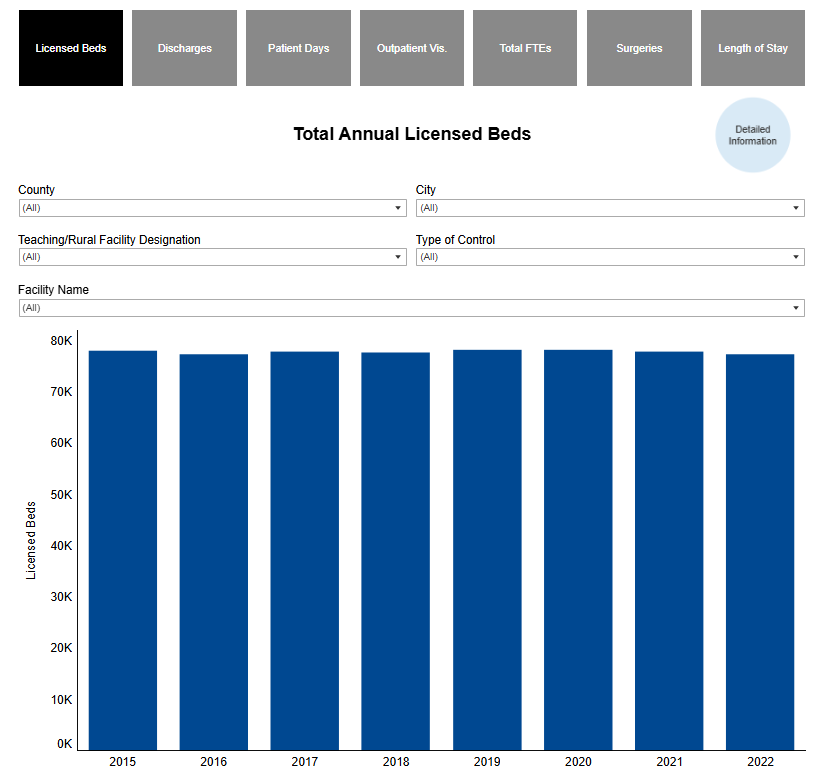 Hospital Financial Data Interactive Series: Hospital Utilization
Visualizations on bed counts, discharges, staffing hours and other utilization information on California hospitals.
-
 Get the Facts About the Office of Health Care Affordability
Understand the role of the Office of Health Care Affordability at the Department of Health Care Access and Information.
-
 Prescription Drug Wholesale Acquisition Cost Increase Data Now Available Through The Fourth Quarter of 2020
View data through the third quarter of 2020 on wholesale acquisition cost increases for prescription drugs.
-
 New Quarter of Data Available for New Prescription Drugs
View reported information on specified prescription drugs introduced to market in the first two quarters of 2019.