

California Postoperative Sepsis Outcomes for Inpatient Elective Surgeries
In 2024, 887 out of 209, 807 adult patients (0.42%) developed postoperative sepsis in California hospitals, following an elective surgery, compared to 1,038 cases out of 219,922 patients (0.47%) in 2023.
Why is the Postoperative Sepsis Indicator Important?
HCAI produced the current report using the risk-adjusted model developed by the federal Agency for Healthcare Research and Quality (AHRQ) for Patient Safety Indicators (PSIs). The Postoperative Sepsis Indicator, part of AHRQ’s PSI set, measures adult patients who develop sepsis in the hospital following elective surgery. This measure, along with the other PSIs, focuses on potentially avoidable in-hospital complications and adverse events that represent opportunities for improvement in the delivery of care. The results provide risk-adjusted hospital rates and performance ratings on postoperative sepsis. Hospitals can utilize the report to improve quality of care and patients can use it to make informed health care decisions.
Which Hospitals Have Better and Worse Postoperative Sepsis Ratings?
Hospitals were rated “Better,” “As Expected,” or “Worse” by comparing their risk-adjusted postoperative sepsis rates with the overall state rates. Risk adjustment is a statistical methodology that takes into account a patient’s age, sex, underlying health conditions, and surgeries the patient has undergone. The majority of hospitals were rated “As Expected,” indicating their postoperative sepsis rates were not significantly different than the state average. Hospitals with a higher postoperative sepsis rate are distinguished from those with a lower rate, indicating opportunities for health care quality improvement.
Key Findings
- There was less variation in the number of hospitals with “Better” and “Worse” ratings in 2024 compared to 2023, indicating a potential movement of healthcare quality towards the expected rate:
- In 2024, of the 287 hospitals that were assigned a risk-adjusted rate and performance rating, four hospitals (1.4%) were rated “Better,” 11 hospitals (3.8% were rated “Worse,” and 272 hospitals (94.8%) were rated as “As Expected.”
- In 2023, of the 287 hospitals that were assigned a risk-adjusted rate and performance rating, nine hospitals (3.1%) were rated “Better,” 15 hospitals (5.2%) were rated “Worse,” and 263 hospitals (91.6%) were rated as “As Expected.”
- In 2024, of the 287 hospitals that were assigned a risk-adjusted rate and performance rating, four hospitals (1.4%) were rated “Better,” 11 hospitals (3.8% were rated “Worse,” and 272 hospitals (94.8%) were rated as “As Expected.”
- Most hospitals maintained consistent performance ratings between 2023 and 2024, though a subset experienced rating changes. In 2024, 15 hospitals improved their ratings compared to the previous year: 13 moved from “Worse” to “As Expected,” and two moved from “As Expected” to “Better.” Meanwhile, 16 hospitals saw declines in performance, with seven shifted from “Better” to “As Expected,” and nine moved from “As Expected” to “Worse.”
The visualization below shows hospitals’ postoperative sepsis rates and performance ratings from 2019 through 2024. Under the Map and Table tab, the Rating filter allows the user to select a performance category (“Better,” “Worse,” or “As Expected”) and view the hospitals in that category. Under the Hospital Ratings Over Year tab, the Performance Ratings filter shows California hospitals’ performance trends on the postoperative sepsis measure for 2019-2024. Because the Agency for Healthcare Research and Quality (AHRQ) has updated its software and measure specifications over the years, year-to-year comparisons should be interpreted with caution.
Visualization
Note: Hospitals with fewer than three patients discharged with elective surgeries were excluded from reporting due to the AHRQ methodological requirement.
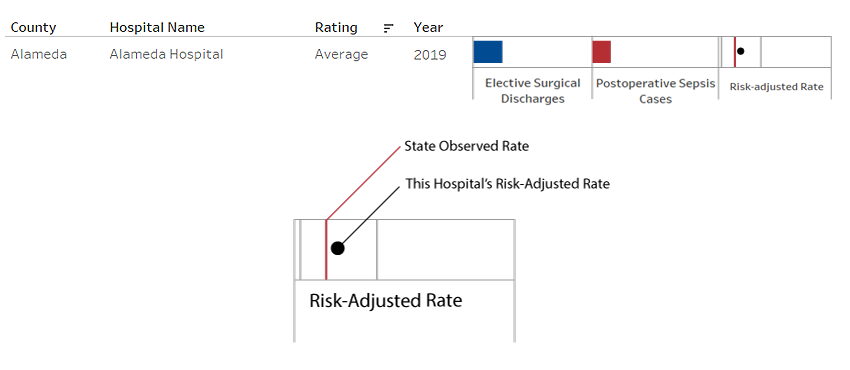
Understanding the Data
This diagram explains how hospital postoperative rates are depicted in the visualization.
Additional Information
Topic: Healthcare Quality
Source Link: Healthcare Quality – AHRQ Quality Indicators
Citation: HCAI – AHRQ Quality Indicators – Postoperative Sepsis Outcomes for Elective Surgeries in California Hospitals, 2019-2024
Temporal Coverage: 2019-2024
Spatial/Geographic Coverage: Statewide, County
Frequency: Annually