Healthcare Utilization Data
Latest Releases
-
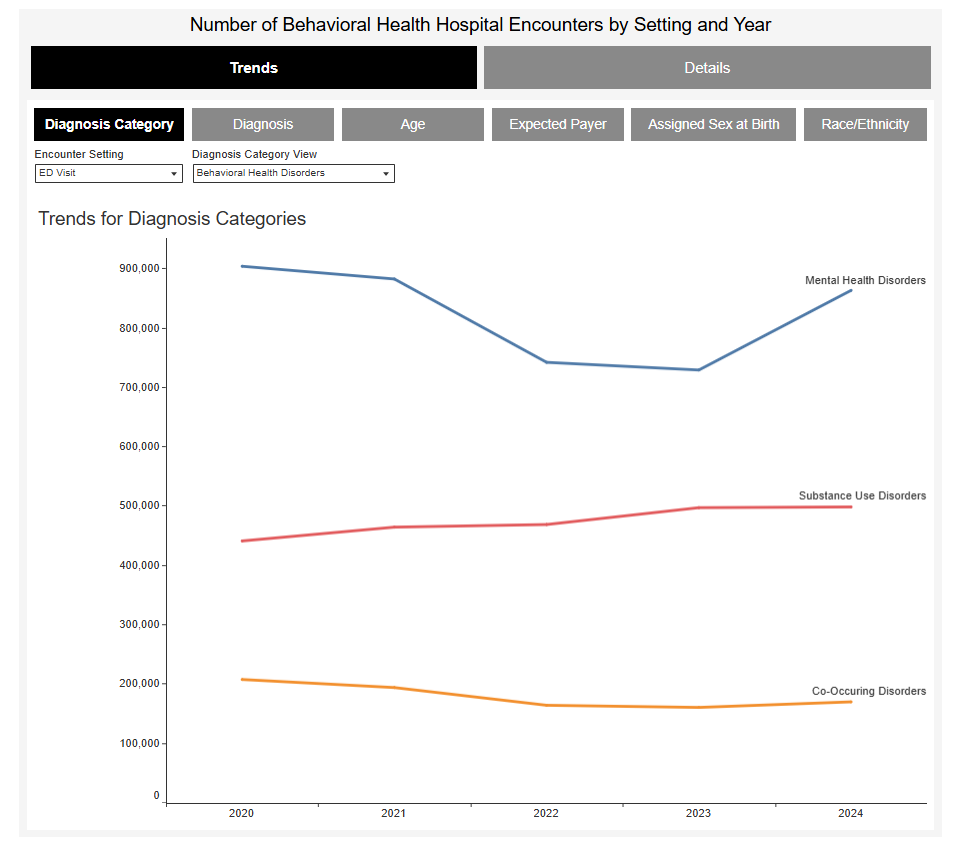 Inpatient Hospitalizations and Emergency Department Visits for Patients with a Behavioral Health Diagnosis in California: Patient Demographics
The number of hospital encounters with a behavioral health diagnosis increased by almost 165,000 from 2023 to 2024, with Mental...
-
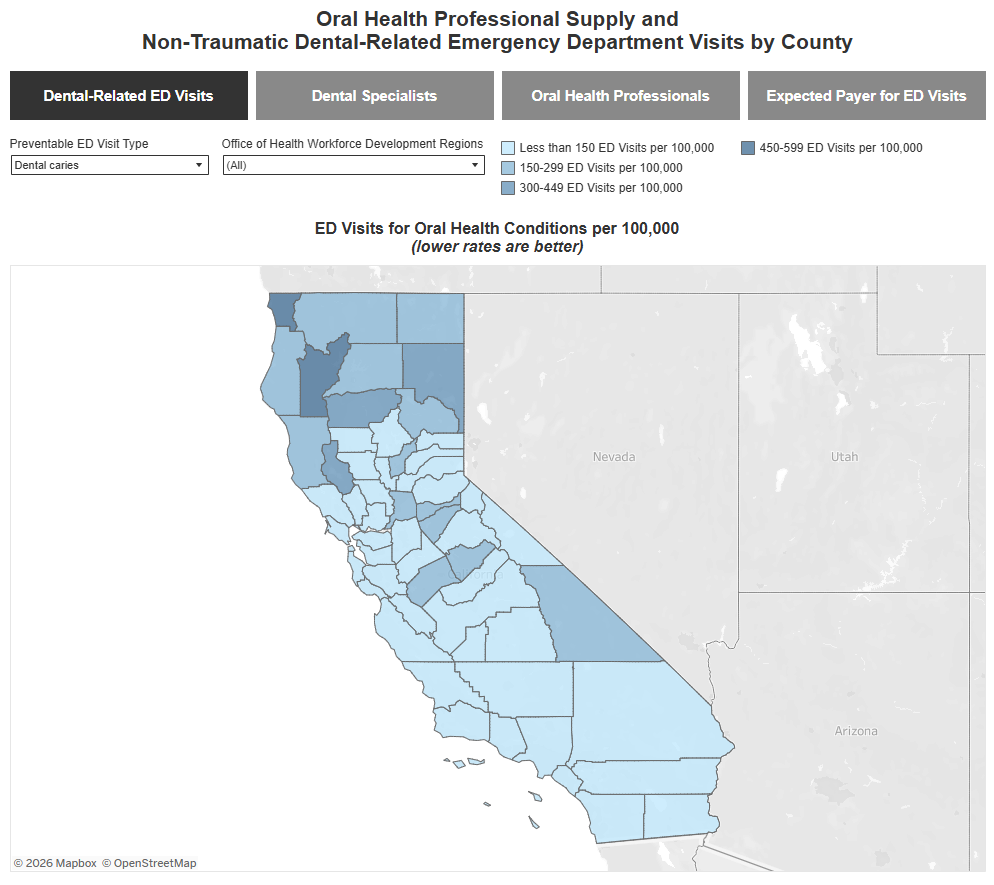 Oral Health Professional Supply and Non-Traumatic Dental Emergency Department Visits
This visualization displays the rates of preventable ED visits for non-traumatic dental conditions, rates of dentists, and rates of oral...
-
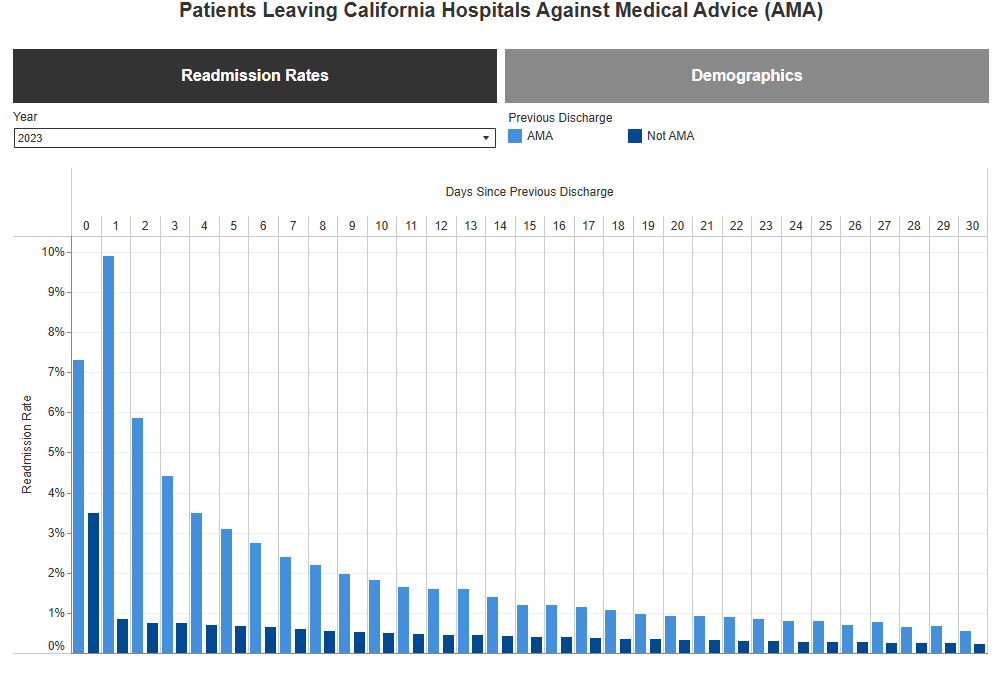 Patients Leaving California Hospitals Against Medical Advice
A visualization showing readmission rates and demographics of patients after leaving a hospital against medical advice.
-
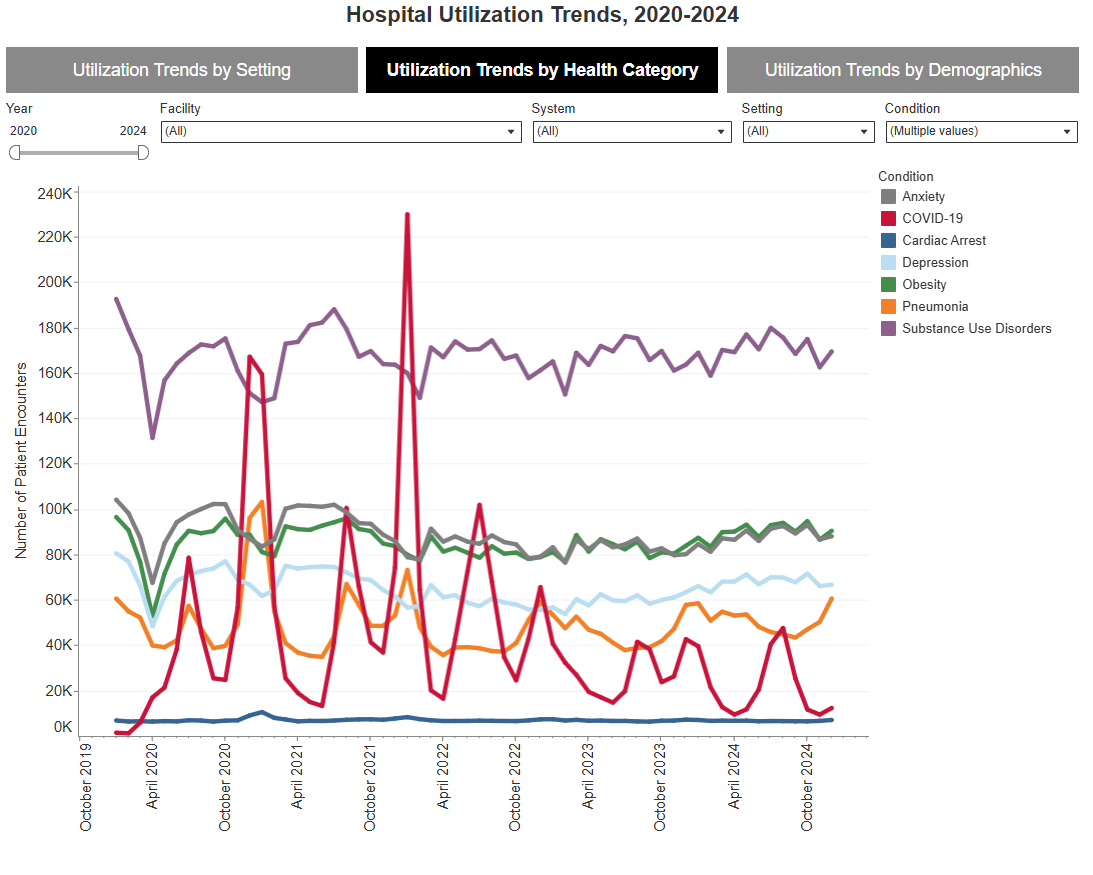 Hospital Utilization Trends
These visualizations present updated data and allow users to filter utilization trends by demographics, conditions, and facilities.
-
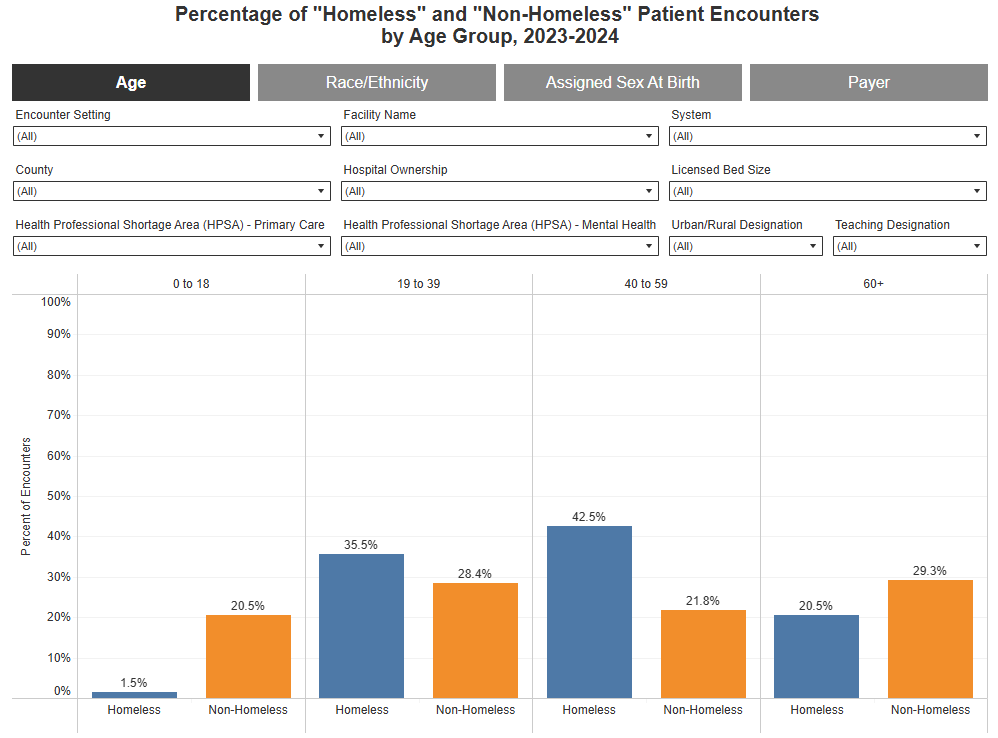 Hospital Encounters for Persons Experiencing Homelessness in California: Patient Demographics by Facility, 2023-2024
This visualization shows the percent of encounters for “Homeless” patients and the percent of encounters for “Non-Homeless” patients by demographics.
-
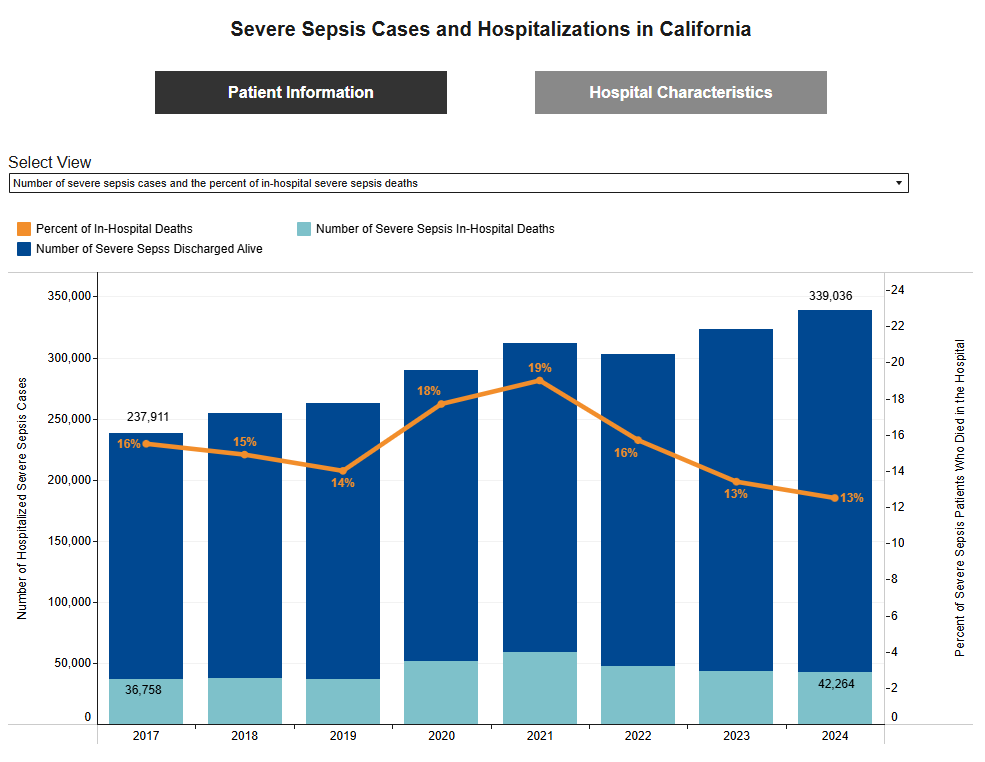 Hospitalizations for Severe Sepsis in California
Visualization on patient data on in-hospital and 30-day mortality, length of stay, charges, and expected payers for severe sepsis hospitalizations.
-
 Maternity Care Honor Roll, 2025
An overview of California hospitals that exceeded performance standards for maternity services.
-
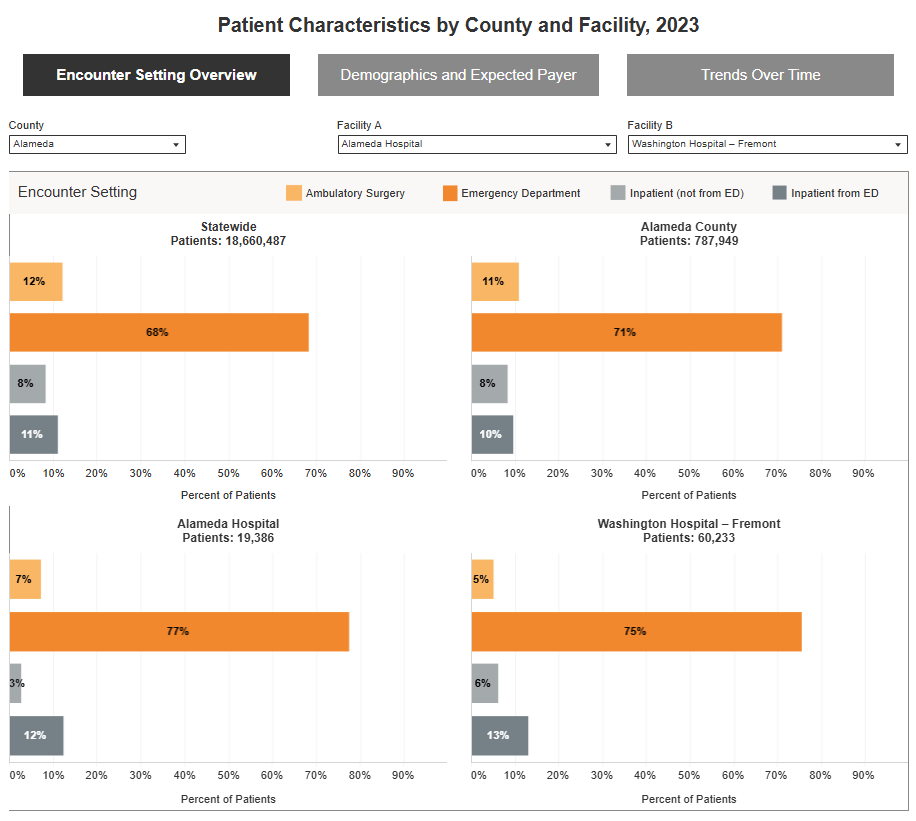 Patient Characteristics by County and Facility
A visualization presenting a calendar year overview of patients in general acute care hospital settings in California.
-
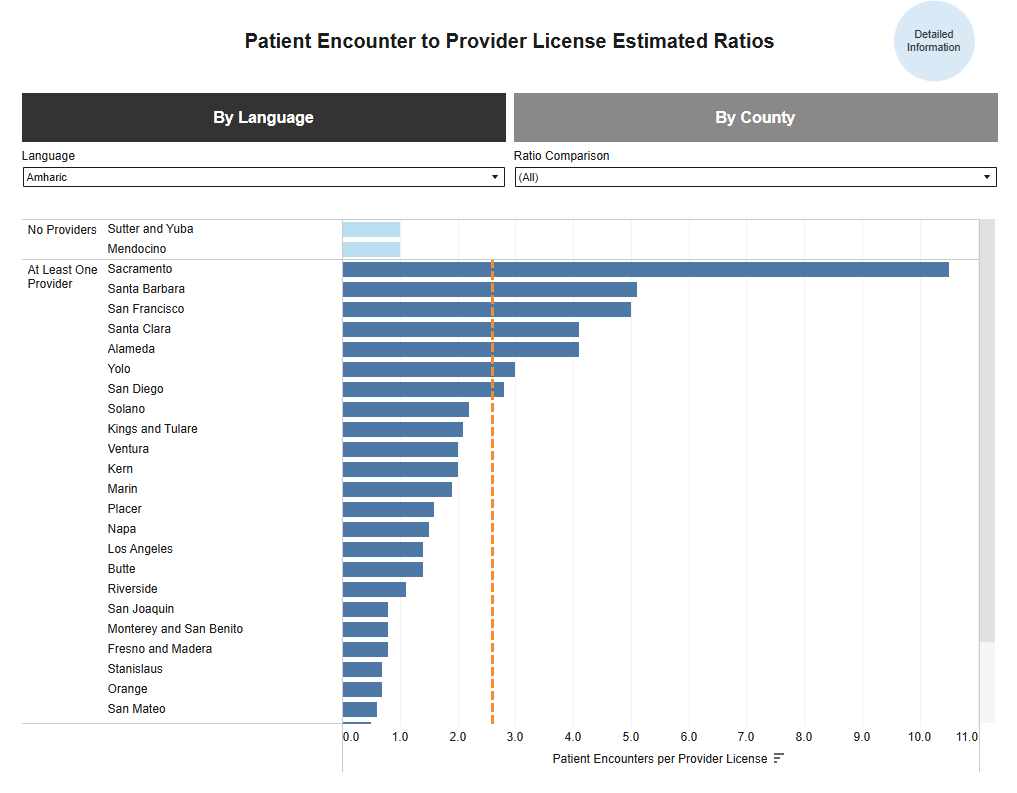 Languages Spoken by Patients and Hospital-Based Providers in California
Visualizations representing potential language gaps between patients and hospital providers at county level.
-
 Alcohol-Related Emergency Department Encounters in California
A visualization examining alcohol-related ED visits and admissions by various social demographics from 2020 through 2023.