Hospital and Workforce Behavioral Health Data in California
New Analysis of Behavioral Health Spending
Behavioral Health Spending in California’s Commercial Market is a new analysis from the Health Care Payments Data System (HPD) that offers insights into statewide spending on behavioral health services across the state.
To better understand and respond to the growing behavioral health needs impacting healthcare services throughout California, HCAI offers a range of topical data products focused on behavioral health. These resources include key findings and trends that help inform strategies, improve program effectiveness, and promote health equity for all Californians.
Defining Behavioral Health
Behavioral health is an umbrella term that covers mental health (e.g., depression, anxiety disorders, schizophrenia and other psychoses) and substance use disorders. It includes our emotional, psychological, and social well-being. It helps determine how we handle stress, relate to others, and make healthy choices. Behavioral health is important at every stage of life, from childhood and adolescence through adulthood.
California Hospital & Workforce Behavioral Health Data Snapshot
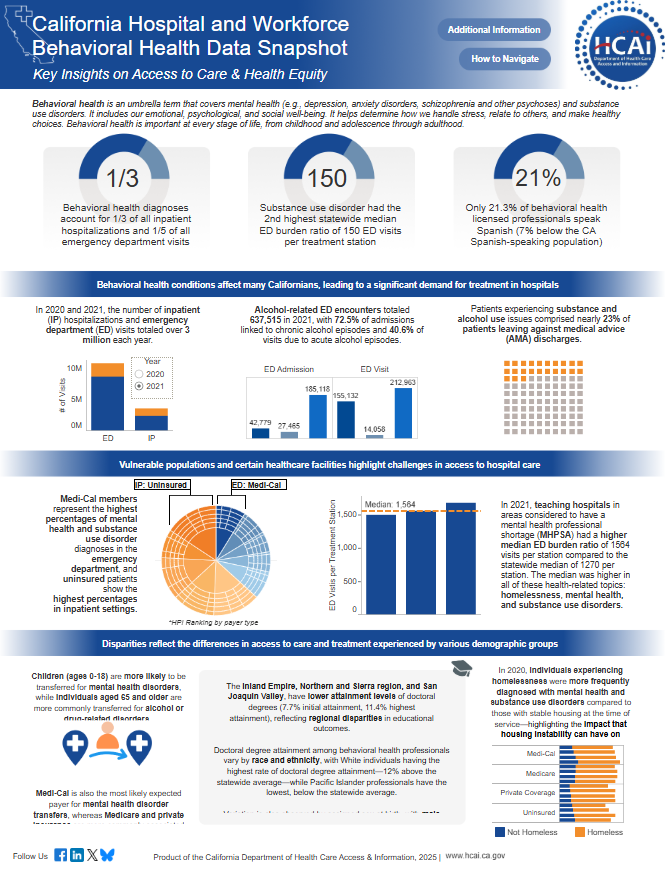
The California Hospital and Workforce Behavioral Health Data Snapshot is an interactive infographic that provides the most pertinent HCAI behavioral health data. Key themes identified in the analysis include service volume, access to care, and health equity.
Users are able to explore trends highlighted by the data and may also print a PDF copy. Click the three dots icon![]() on the bottom right corner and select PDF to print. (Please note that the hover-over tooltips shown in the interactions will not be printed.)
on the bottom right corner and select PDF to print. (Please note that the hover-over tooltips shown in the interactions will not be printed.)
The Behavioral Health Hospitalization Landscape
The National Institute of Mental Health reported that nearly one-in-five adult Americans live with a mental illness. In California, that equates to nearly eight million people. HCAI’s behavioral health data indicates potential strains on the California healthcare system, as the prevalence of behavioral health diagnoses has risen in recent years. Inpatient (IP) stays and emergency department (ED) visits often become the default response when individuals face acute behavioral health crises due to gaps in community-based care, prevention programs, and outpatient services.
In 2020 and 2021, more than one-third of all IP hospitalizations and one-fifth of all ED visits were linked to a behavioral health diagnosis. This amounts to approximately three million behavioral health-related hospitalizations each year, which translates to about six hospitalizations every minute:
- 3,359,970 hospitalizations per year
- 279,998 hospitalizations per month
- 9,192 hospitalizations per day
- 383 hospitalizations per hour
- 6.38 hospitalizations per minute
Based on the time you’ve spent on this page, the timer below displays the average count of hospitalizations with a behavioral health diagnosis as time progresses.
The continuum of care in behavioral health extends far beyond ED visits and IP hospitalizations. After initial stabilization in the ED or IP setting, patients often transition to outpatient services such as therapy, medication management, and case management to continue their recovery in a less intensive environment. Additionally, community resources like housing support, peer counseling, and substance use programs play a critical role in long-term recovery by offering support and resources as patients reintegrate into their communities. Follow-up care ensures that patients maintain their progress and avoid relapse, often through regular check-ins and preventive programs. For more information on continuum of care, visit the Mental Health for All Initiative, Children and Youth Behavioral Health Initiative (CYBHI), and the Certified Wellness Coach program.
HCAI Data Products
Hospital and workforce behavioral health data is integrated into many HCAI featured data visualization products, across the topics of healthcare utilization, health workforce, and cost transparency. Explore the products below to learn more about how HCAI data provides valuable insights about California’s healthcare system.
Healthcare Utilization Products with Behavioral Health Data
Patient-level administrative data abstracted from individual patient records and facility-level utilization data on healthcare services from hospitals and healthcare facilities.
- Behavioral Health Providers, Encounters, and Diagnoses in California’s Hospital Inpatient and Emergency Department Settings
- Mental and Behavioral Health Diagnoses in Emergency Department and Inpatient Discharges by Healthy Places Index Ranking
- Alcohol-Related Emergency Department Encounters in California
- Inpatient Hospitalizations and Emergency Department Visits for Patients with a Behavioral Health Diagnosis in California: Patient Demographics
- Inpatient Hospitalizations and Emergency Department Visits for Persons Experiencing Homelessness in California: Patient Demographics By Facility
- Patients Leaving California Hospitals Against Medical Advice (AMA)
- Acute Care Hospital Transfers by Major Diagnostic Category (MDC)
- Emergency Department Volume and Capacity by Facility, Health Category and Health Professional Shortage Area
- Effects of COVID-19 on Hospital Utilization Trends
Health Workforce Products with Behavioral Health Data
Workforce data showcasing employment and educational data trends in California.
- Supply and Demand Modeling for California’s Behavioral Health Workforce
- Preferred Languages Spoken in California Facilities
- Languages Spoken by California’s Health Workforce
- Race & Ethnicity of California’s Health Workforce
- California’s Health Workforce Education Pathways
Cost Transparency Products with Behavioral Health Data
Hospital and long-term financials, Chargemasters, prescription drug costs, healthcare claims, and more to support and advance healthcare cost transparency.
Additional Information
Topic: Healthcare Utilization, Health Workforce, Cost Transparency
Source: Healthcare Utilization – Patient-Level Administrative Data, Hospital Utilization Data, Healthcare Utilization – Inpatient Discharges, Health Professional Shortage Areas in California, Hospital Emergency Department – Encounters by Facility, HCAI Health Workforce Languages Spoken Data, HCAI Heath Workforce Race & Ethnicity Data, HCAI Health Workforce Education Data, Cost Transparency – Healthcare Payments Database
Citation: HCAI — California Hospital & Workforce Behavioral Health Data Snapshot, 2021-2023
Temporal Coverage: Includes the most recent data available, including data from 2019 to 2023
Spatial/Geographic Coverage: Statewide
Frequency: Annually