Alcohol-Related Emergency Department (ED) Encounters in California, 2008 – 2017

There was a 66.7 percent increase in alcohol-related ED visits from 2008 to 2017, and a 36.9 percent increase for alcohol-related ED admissions.
A recent national study on alcohol-related visits to emergency departments (ED) found a nearly 50 percent increase in these visits between 2006 and 2014 (White et al., 2018.) In response to this report, the Department of Health Care Access and Information (HCAI) explored whether a similar trend was occurring in California and found a 66.7 percent increase in alcohol-related ED visits from 2008 to 2017.
HCAI examined both types of ED encounters: (a) “ED visits,” where a patient was treated for an alcohol-related episode and then released; and (b) “ED admissions,” where a patient was seen in the ED and directly admitted to that hospital for inpatient treatment of an alcohol related episode.
Key Findings
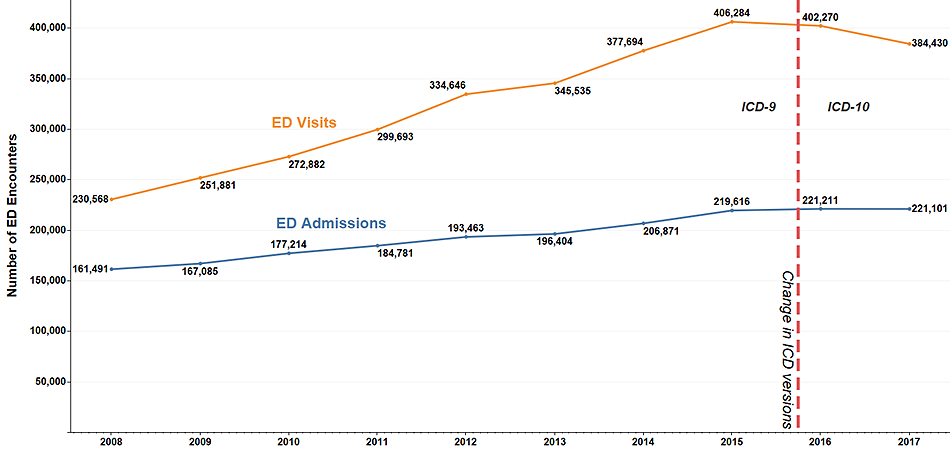
- There was a 66.7 percent increase in alcohol-related ED visits from 2008 to 2017, and a 36.9 percent increase for alcohol-related ED admissions (Figure 1). There was a decrease in the numbers of ED visits between the end of
2015 and 2017; however, this may be attributed to the implementation of the International Classification of
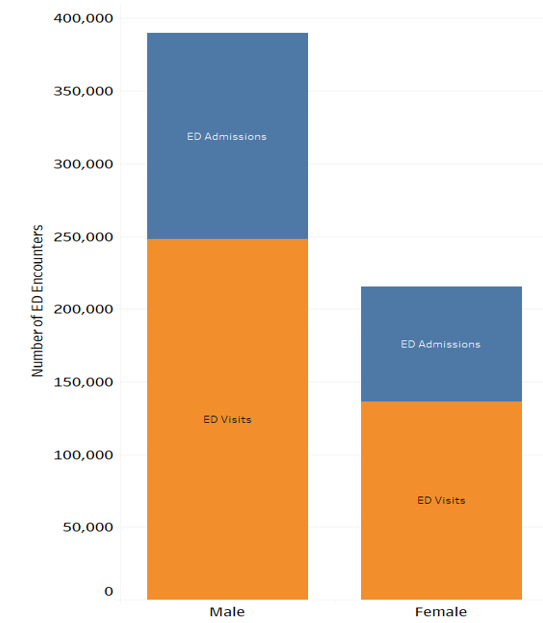
Diseases, 10th revision, Clinical Modification (ICD-10-CM), which provides codes to identify medical conditions. - The total number of alcohol-related ED visits and admissions for males was almost twice as high as the number for females in 2017 (389,992 vs. 215,493) (Figure 2).
- The number of alcohol-related ED visits and admissions increased for all four race/ethnicity groups (Non-Hispanic
Whites, Hispanics, Blacks and Asian/Pacific Islander) between 2008 and 2017 (Figure 3). Asian/Pacific Islander and Hispanics showed the highest increases, 119.7 and 75.0 percent, respectively.
There was a 66.7 percent increase in alcohol-related ED visits between 2008 and 2017 (230,568 to 384,430); however, there was a slight decrease, 5.4 percent, from 2015 to 2017 (406,284 to 384,430). Similarly, there was a 36.9 percent increase in alcoholrelated ED admissions between 2008 and 2017, while during the 2015 to 2017 time period, the trend was relatively flat (0.7 percent increase) (Figure 1).
Figure 1. Number of Alcohol-Related Emergency Department (ED) Visits
and ED Admissions, 2008 – 2017
There were almost twice as many ED visits for alcohol-related reasons by males (247,841) compared to females (136,548) in 2017. There was a similar pattern for alcohol-related ED admissions, with the number of male ED admissions being 80.1 percent higher than females. The number of alcohol-related ED visits for females (136,548) was comparable to the number of alcohol-related ED admissions for males (142,151) in 2017. The total number of alcohol-related ED encounters for males was almost twice what was reported for females in 2017 (389,992 vs. 215,493) (Figure 2).
Figure 2. Alcohol-Related ED Encounters (ED Visits and ED Admissions) by Gender, 2017
Source: Department of Health Care Access and Information, Emergency Department Data and Patient Discharge Data, 2008-2017
The number of alcohol-related ED encounters increased for all four race/ethnicity groups between 2008 and 2017. The highest increase was for Asian/Pacific Islanders with an increase of 119.7 percent, followed by Hispanics with a 75 percent increase, then Blacks with 55 percent, and Non-Hispanic Whites with a 38 percent increase. However, between 2016 and 2017 there was an overall decrease in alcohol-related visits to the ED for all four groups with the largest decreases for Blacks and Non-Hispanic Whites (7.3 percent decrease and 5.5 percent decrease, respectively). Both Hispanics and Asian/Pacific Islanders had a negligible decrease (0.6 and 0.1 percent, respectively) (Figure 3).
Figure 3. Alcohol-Related Emergency Department (ED) Encounters by Race/Ethnicity, 2008 – 2017
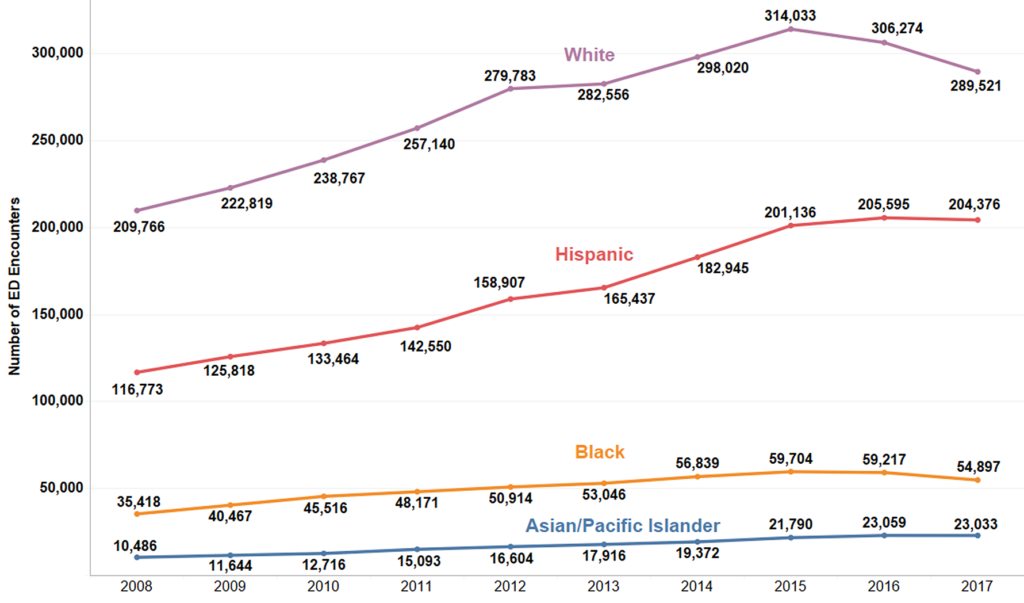
Source: Department of Health Care Access and Information, Emergency Department Data, 2008-2017.
Additional Resources
The rate of alcohol-related inpatient stays in the United States increased by 33 percent between 2013 and 2014 (from 81.4 to 108.0 stays per 100,000 population). However, the proportion of the U.S. population with alcohol dependence decreased by 14 percent between 2002 and 2013 (from 7.7 percent to 6.6 percent). (HCUP Statistical Brief #245).
According to the National Survey on Drug Use and Health (NSDUH):
• In 2014, alcohol-impaired driving fatalities accounted for 9,967 deaths (31 percent of overall driving fatalities) in the United States.
• In 2015, of the 78,529 liver disease deaths among individuals ages 12 and older, 47.0 percent involved alcohol. Among males, 49,695 liver disease deaths occurred and 49.5 percent involved alcohol. Among females, 28,834 liver disease deaths occurred and 43.5 percent involved alcohol.
Data Reports
Data Pulse – Severe Sepsis: In-Hospital Mortality
Data Pulse – Severe Sepsis: 30-Day Mortality
Data Pulse – Severe Sepsis Hospitalizations: Length of Stay, Charges and Payers
Data Pulse – California In-Hospital Deliveries Vary by Mother’s Age
Additional Information
Topic: Healthcare Utilization
Temporal Coverage: 2008-2017
Spatial/Geographic Coverage: Statewide
Source: Emergency Department Data and Patient Discharge Data 2008-2017, Department of Health Care Access and Information