Healthcare Payments Data (HPD): Fee-For-Service Drug Costs in California
In 2022, pharmacies in California billed insurance plans for over 344 million fee-for-service prescriptions for over 22 million individuals, costing over $51.1 billion in total statewide spending.
Introduction
The Prescription Drug Costs in California Report allows users to explore various aspects of the cost of pharmaceuticals covered by insurance plans in the state of California in 2021 and 2022. These visualizations are made possible by data collected as part of HCAI’s Healthcare Payments Data (HPD) program.
The visualizations cover three topics:
- The Top 25 costliest drug products in terms of total annual statewide spending, which is a sum of the total amount paid by insurance plans and the total amount paid by consumers (i.e., out-of-pocket costs) for that drug product,
- The Top 25 most frequently prescribed drugs covered by insurance plans, and
- The Top 25 drugs by monthly median out-of-pocket cost for members of insurance plans, which is the median amount paid by the consumer for a month’s supply of a drug product.
These visualizations present data from fee-for-service retail pharmaceutical claims paid by Medi-Cal, Medicare or commercial plans. All analyses were conducted at the level of the National Drug Code (NDC). The analyses of total costs and out-of-pocket costs do not include rebates, coupons, or other discounts (see the Notes and Glossary sections for definitions and more details).
Each visualization displays the total number of retail prescriptions statewide, the number of unique individuals with at least one prescription, the total statewide spending, average cost per unit, and the monthly median out-of-pocket cost per member across all prescriptions. The first visualization is a comparison of the statewide totals by payer type and the same figures based only on the chosen set of Top 25 drugs. Below that is the list of Top 25 drugs by NDC. The user can choose the desired year, set of Top 25 drugs, and drug category using the filters at the top of the visualization. Hovering over specific data elements within the visualizations will display additional information in the tooltip. For example:
- Hovering over any number in the visualization tables will provide additional information about the associated drug product including its NDC, its generic name, drug category, therapeutic class and a description of the drug. Some drug names appear multiple times because each represents a distinct variant of the same drug product, identified by a unique NDC. Variants can differ based on strength, dosage form, or number of units, and other factors.
- Hovering over any number under “Average Cost per Unit” will also provide the average number of dispensed units per fill and the drug unit of measure (e.g., pill, milliliter).
- Hovering over any number under “Monthly Median Out-Of-Pocket Cost” will also provide the 25-percentile, 75-percentile and the percentage of out-of-pocket costs that are zero.
All visualizations have a filter for drug category (i.e., all, brand, generic, biosimilar or biologic), payer type (i.e., All Payers; All, Excluding Medi-Cal; Commercial; Medicare; Medi-Cal) and year (i.e., 2021 or 2022). Using these filters will alter the list of drugs shown and change the statewide totals and the Top 25 totals. With these filtering options, the visualizations can answer a range of questions such as:
- What are the Top 25 costliest drugs for commercial insurance members in 2021?
- What are the Top 25 most frequently prescribed biosimilar drugs and the average cost per unit in 2021?
- What are the 25 drugs having the largest monthly median out-of-pocket cost in 2022?
Key Findings
- Top 25 Costliest Prescription Drugs: The 25 costliest drugs account for just 2.1% of all prescriptions in California but account for nearly 25% of total costs at nearly $12 billion in 2022.
- In the commercial market between 2021 and 2022, the number of prescriptions statewide increased 1.6% (101.6M to 103.2M) while the total cost of the prescriptions increased 11.6% ($13.3B to $14.9B).
- Top 25 Most Frequent Prescriptions: The three most frequent prescriptions in California in 2021 were all COVID-19 vaccines and had zero out-of-pocket costs. In 2022, the 25 most frequent prescriptions accounted for 7.6% of all prescriptions and 3.0% of total costs at $1.5 billion.
- Top 25 Drugs by Out-of-Pocket Costs: The monthly median out-of-pocket cost for the 25 prescription drugs with the highest monthly median out-of-pocket cost ranged from $150 to $250 in the commercial insurance market. State policy limits the maximum out-of-pocket cost for the commercial market to $250 per prescription in most cases.
Totals for prescriptions, individuals, and costs may be different from those reported in other HPD products. Such comparisons should hence be made with caution. For example, prescriptions paid under a capitated arrangement are not included. Also, due to the launch of the Medi-Cal Rx program on January 1, 2022, the number and proportion of Medi-Cal pharmaceutical claims paid under a fee-for-service arrangement changed dramatically between 2021 and 2022. Finally, some prescriptions were not included in this product because of data quality issues (e.g., having an allowed amount less than zero). Please consult the Technical Note for more information.
Visualization
Notes:
- These visualizations display fee-for-service (FFS) retail pharmaceutical costs (billed on a pharmacy claim) paid by an insurance plan only; medical pharmaceutical costs (billed on a medical/institutional claim), non-FFS (e.g., capitated) pharmaceutical costs, and non-covered drug products are not included in these numbers.
- Each row in the visualizations represents a unique drug product, identified by a unique National Drug Code (NDC). Drug names could be present multiple times because different variants of the same drug product can have the same name despite having distinct NDCs. Two drug products with the same name can have different NDCs because of differences in strength, dosage form, number of units or packaging. For example, the Pfizer-BioNTech COVID-19 Vaccine appears twice due to differences in the number of vials per package between the two products. The Moderna COVID-19 Vaccine also appears twice due to differences in vial volume and the number of vials per package.
- Hovering over the numbers in any row will display the NDC of the associated drug product in the tooltip. For more information about NDCs, see the glossary.
- The cost data does not reflect rebates, coupons, or other discounts, as these are not reported to HCAI.
- The number of dispensed units can vary among prescriptions having the same NDC, which in turn will affect the cost of each prescription. For instance, one prescription may be for a 30-day supply while another may represent a 14-day supply even though both have the same NDC. For this reason, the Average Cost per Unit is reported rather than the Average Cost per Prescription.
Feedback
HCAI anticipates continuing to advance the accessibility and usefulness of HPD as the database becomes more comprehensive and complete and HCAI builds its capacity over time.
HCAI wants your feedback about how you are or are planning to use HPD data and what you would like to see in the future from the HPD Program. Share your feedback with HCAI staff by clicking the button below.
Glossary
Record Types
HPD uses fee-for-service (FFS) retail pharmaceutical claims (billed on a pharmacy claim) records to calculate drug costs. Each row in the visualizations represents a unique National Drug Code (NDC), so drug names can appear multiple times.
National Drug Code (NDC)
- The pharmaceuticals industry assigns a unique number, called the NDC, to each drug product manufactured and sold. NDCs must be provided to the federal Food and Drug Administration (FDA), and are used for ordering, billing, inventory management, and recalls.
- HCAI requires that relevant reporting uses the 11-digit format of the NDC. The three-segments of the format can be broken into the following:
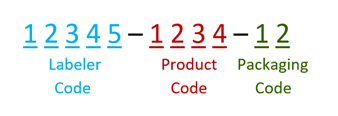
The labeler code, also known as the manufacturer code, identifies who manufactures, repacks, or distributes a given drug product. The product code identifies the drug, its strength, dosage form, and formulation specific to the firm that manufactures the given drug product. The packaging code typically identifies the number of product units in the given product (package size) but also may indicate the type of packaging used.
Cost Figures
Cost data are reported to HCAI using the All-Payer Claims Database Common Data Layout (APCD-CDLTM). The following data elements are used for cost calculations. Note that the cost data do not take rebates, coupons, or other discounts into account, as these are not reported to HCAI.
| Total Cost (Statewide Spending) is the following: | |
| Allowed Amount (CDLPC038) | The maximum amount contractually allowed |
| Out-of-Pocket Cost is a sum of the following: | |
| Copay Amount (CDLPC043) | The dollar amount of the co-payment that the member paid for a prescription |
| Coinsurance Amount (CDLPC044) | The dollar amount of coinsurance (not the percentage) that the member paid for a prescription |
| Deductible Amount (CDLPC045) | The dollar amount that the member paid for a prescription and was applied to the deductible |
| Member Self-Pay Amount (CDLPC048) | The dollar amount that the member paid for a prescription not included in the above out-of-pocket amounts |
Payer Types
Payers are the companies, programs, and organizations that oversee insurance plans and reimburse healthcare providers. Three main types of payers make up the majority of the insurance market.
- Commercial: Insurance products for which the coverage premium is paid by a private party, such as an employer, individual, or other entity.
- Medicare: A federal health insurance program funded by the Centers for Medicare & Medicaid Services under the Social Security Amendments of 1965 that provides healthcare benefits to those aged 65 years and over or to disabled beneficiaries of any age.
- Medi-Cal: A public health insurance program that provides free or low-cost medical services and healthcare benefits to low-income individuals, financed from state and federal funds; California’s version of Medicaid.
How HCAI Created This Product
This product was developed using pharmacy claims data submitted to HCAI’s Healthcare Payments Data (HPD) program, California’s All-Payer Claims Database (APCD).
- Only pharmacy claims paid by Medi-Cal, Medicare or a commercial plans under a fee-for-service arrangement for prescriptions filled during 2021 and 2022 were used for these visualizations.
- Drug products that were prescribed to less than 100 individuals during the year were excluded from the analysis.
- If more than one payer was involved in paying for a claim, the claim is assigned to a primary payer type based on the payer that paid the highest amount.
- Pharmacy records, and the count of prescriptions filled, refer only to medications filled at a pharmacy with a prescription and billed to the payer. These counts do not include physician administered drugs (PADs) received during a visit like anesthesia, analgesics, or IVs. Self-pay prescriptions (no coverage, or coverage not used) are also not included.
- The HPD Program identifies and tracks the unique identity of individuals across different payers over time. The approach is continually refined to ensure an accurate count of unique individuals. As these methods improve, the HPD Program expects to identify more linkages – cases in which two or more records are determined to belong to a single individual. Therefore, the count of unique individuals is likely to decrease over time as linkages are incorporated.
- To protect patient personal information, the California Health and Human Services Agency has adopted a policy of statistically masking or de-identifying sensitive data (CalHHS Data De-Identification Guidelines).
- Additional information on how HCAI created this product is available in the report’s Technical Note.
Additional Information
Topic: Cost Transparency
Source Link: Cost Transparency – Healthcare Payments Database
Citation: HCAI – Healthcare Payments Database – Healthcare Payments Data (HPD) Fee-For-Service Drug Costs in California, 2021-2022
Temporal Coverage: 2021–2022
Spatial/Geographic Coverage: Statewide
Frequency: Annually