Healthcare Utilization Data
Latest Releases
-
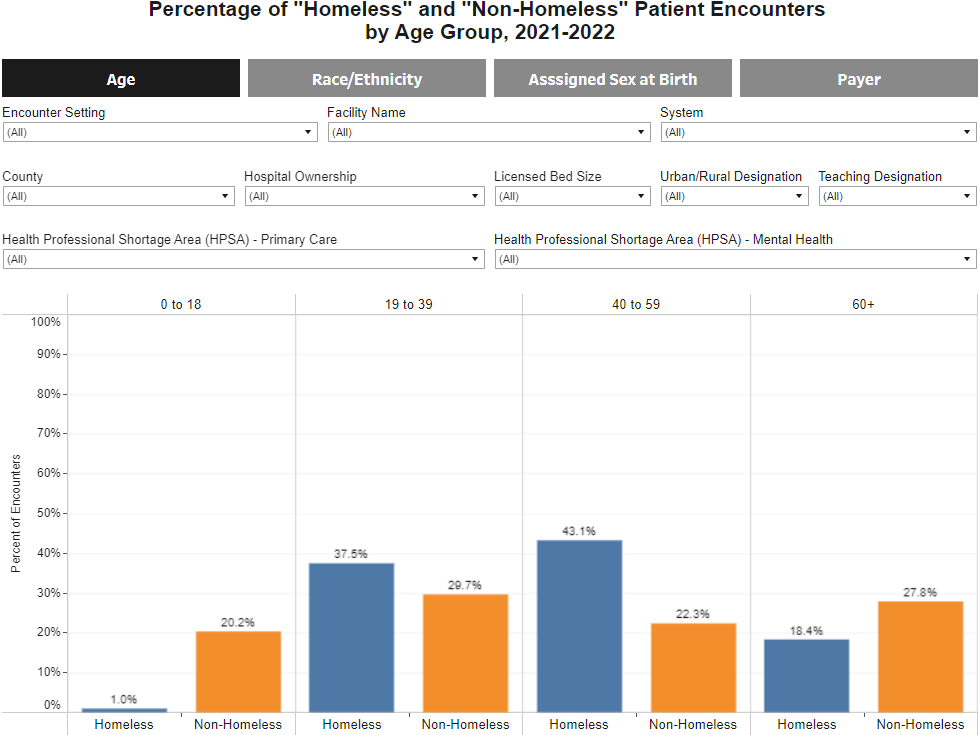 Hospital Encounters for Persons Experiencing Homelessness in California: Patient Demographics by Facility, 2021-2022
Hospital encounters for patients experiencing homelessness (PEH) is an important indicator of hospital and health system utilization.
-
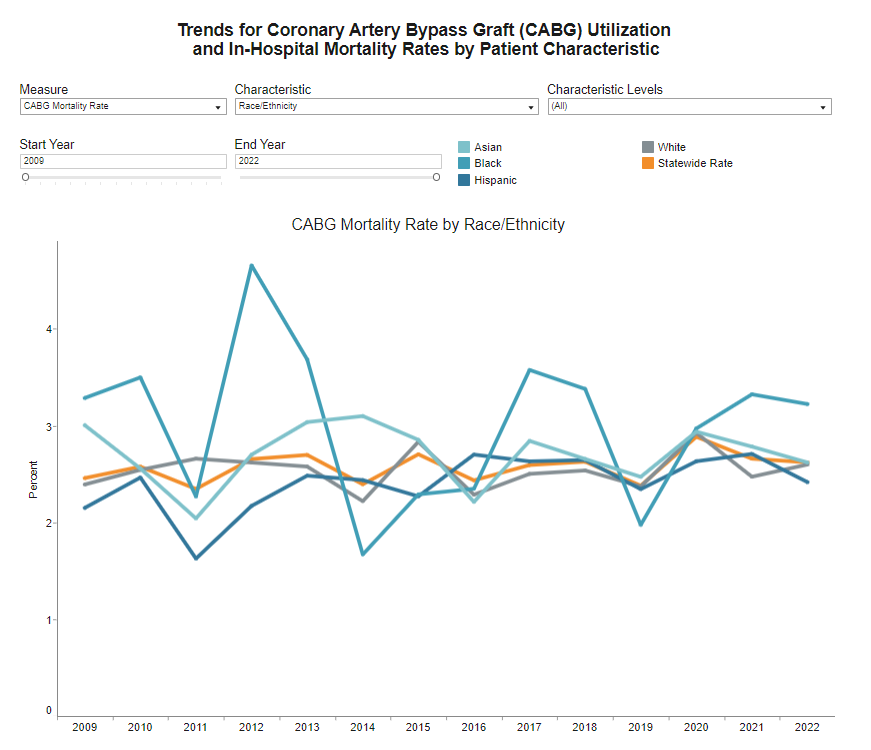 Trends in the Utilization and Mortality for Coronary Artery Bypass Graft (CABG) Surgery in California Hospitals
Trends in the Utilization and Mortality for Coronary Artery Bypass Graft Surgery in California Hospitals.
-
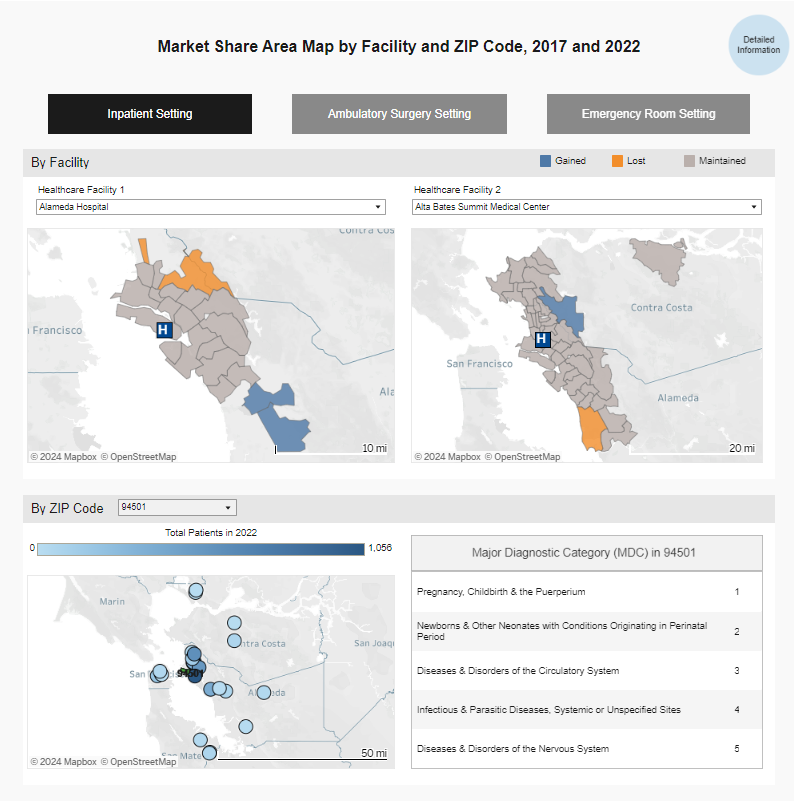 Facility Market Share and Patient Origin
253 healthcare facilities (59.8 percent) gained market share from 2017 to 2022. 163 healthcare facilities (38.5 percent) lost market share...
-
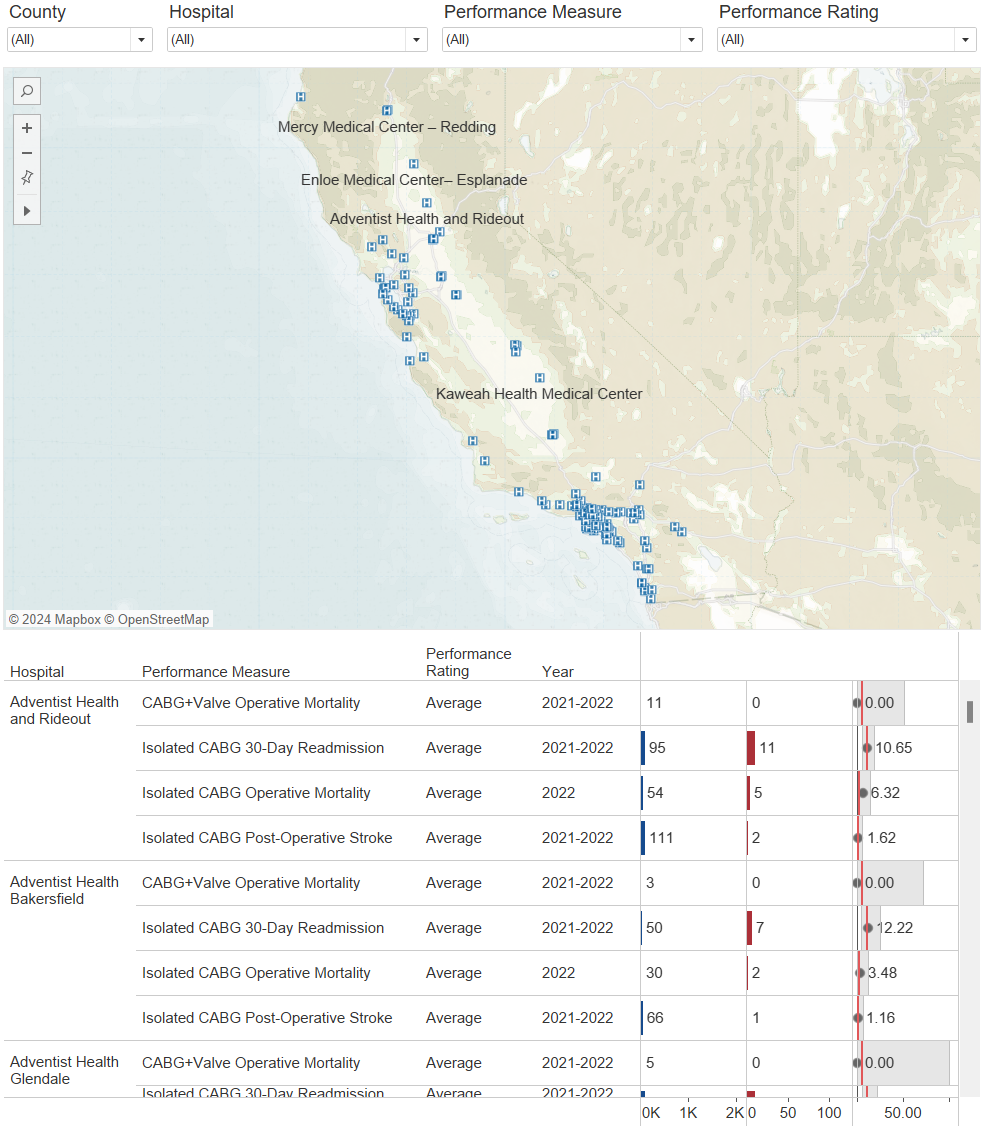 Coronary Artery Bypass Graft: Hospital Performance Ratings, 2022
The CABG performance ratings are based on four key risk-adjusted outcomes: operative mortality for isolated CABG, operative mortality for CABG...
-
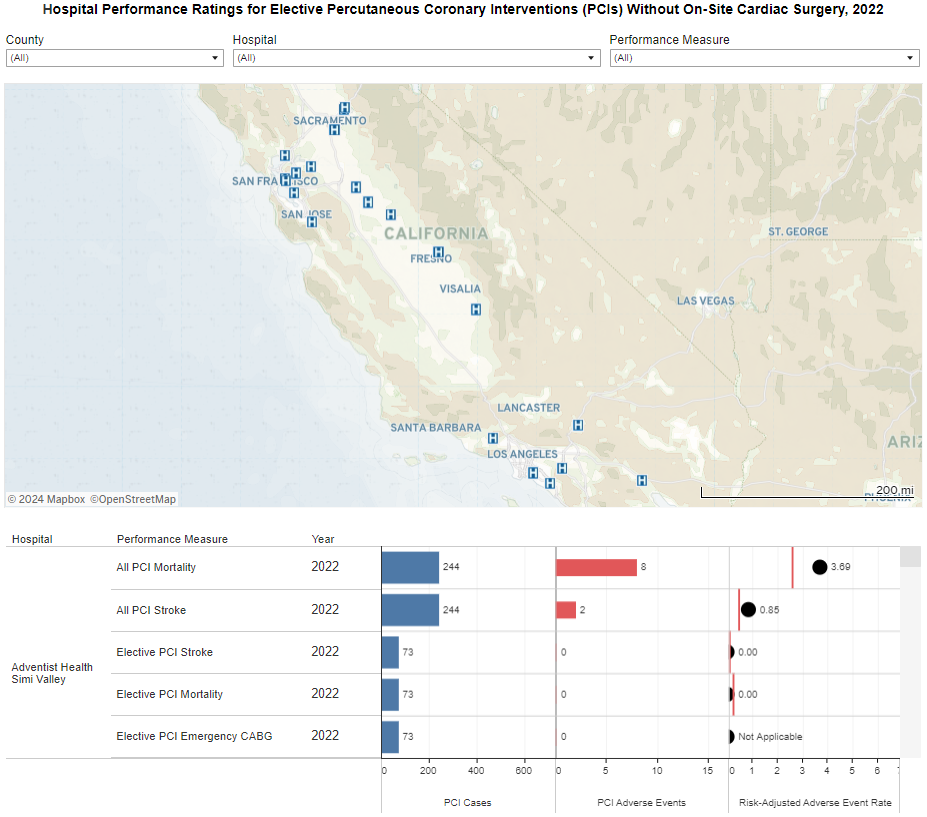 Elective Percutaneous Coronary Intervention (PCI) Program Report, 2022
The California Elective Percutaneous Coronary Intervention (PCI) Program Report provides information on the quality of elective PCIs at California general...
-
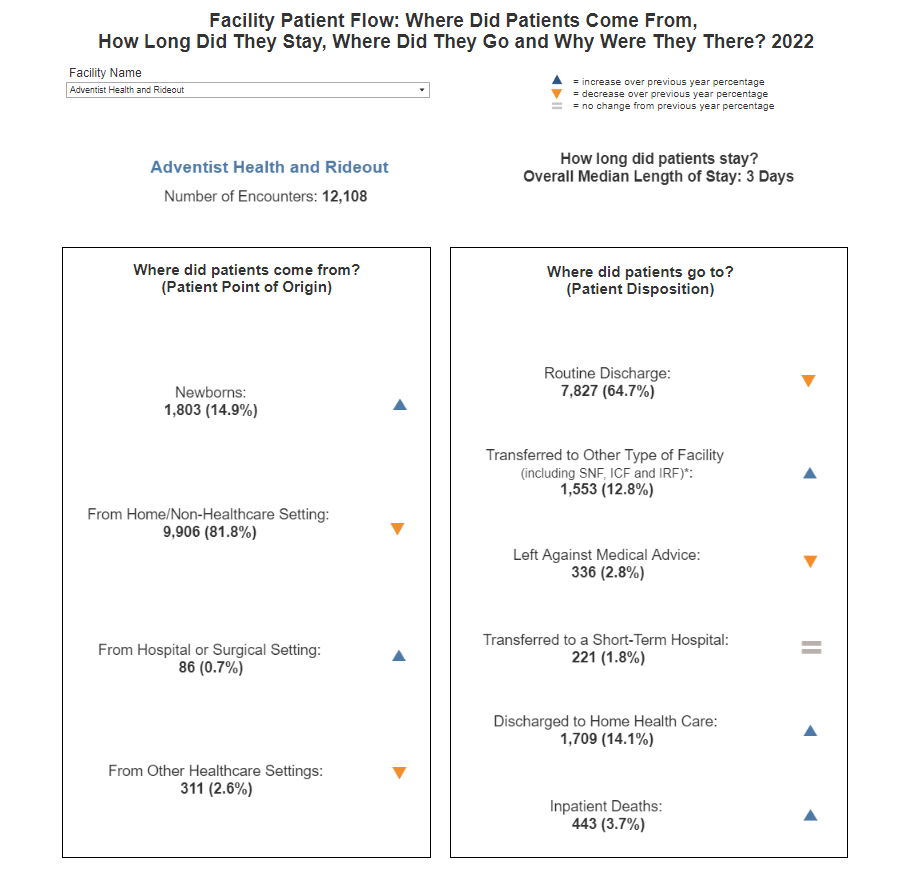 Facility Patient Flow: Where Did Patients Come From, How Long Did They Stay, Where Did They Go and Why Were They There?
The Facility Patient Flow visualization shows the numbers and percentages of where patients come from (based on the patient point...
-
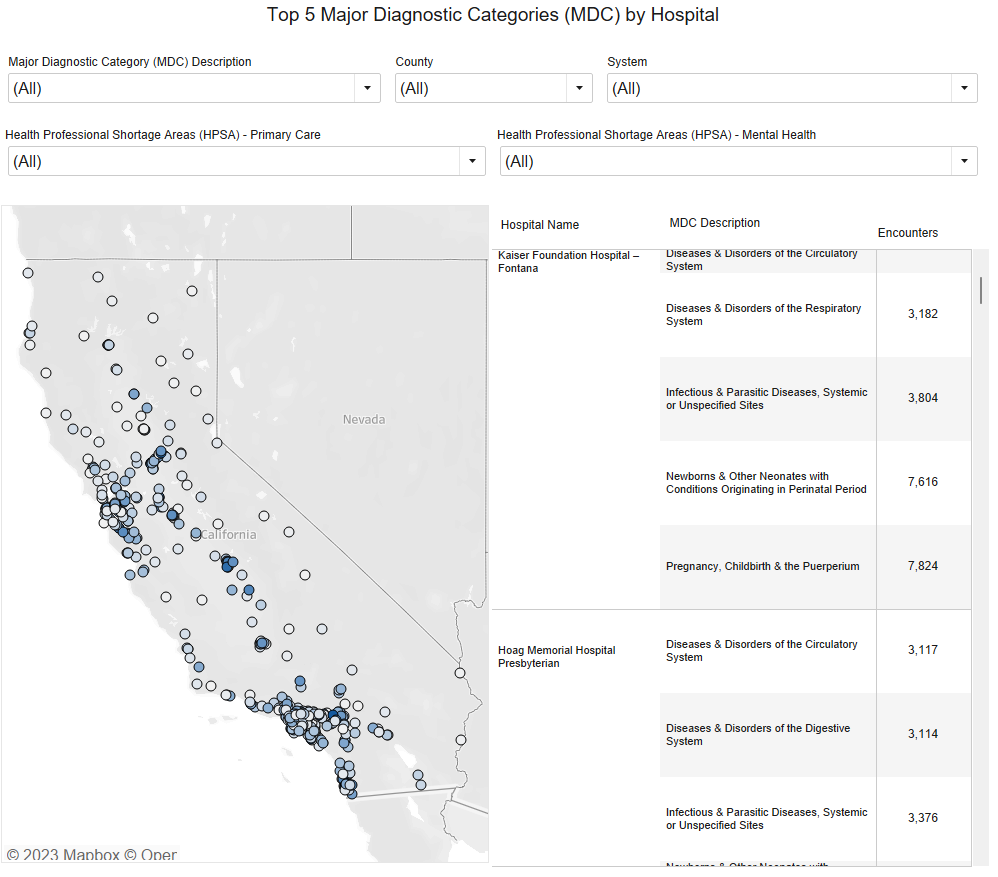 Top Five Major Diagnostic Categories (MDC) for California Hospitals
The Top Five MDCs for each hospital were identified from the number of encounters for each MDC from the Patient...
-
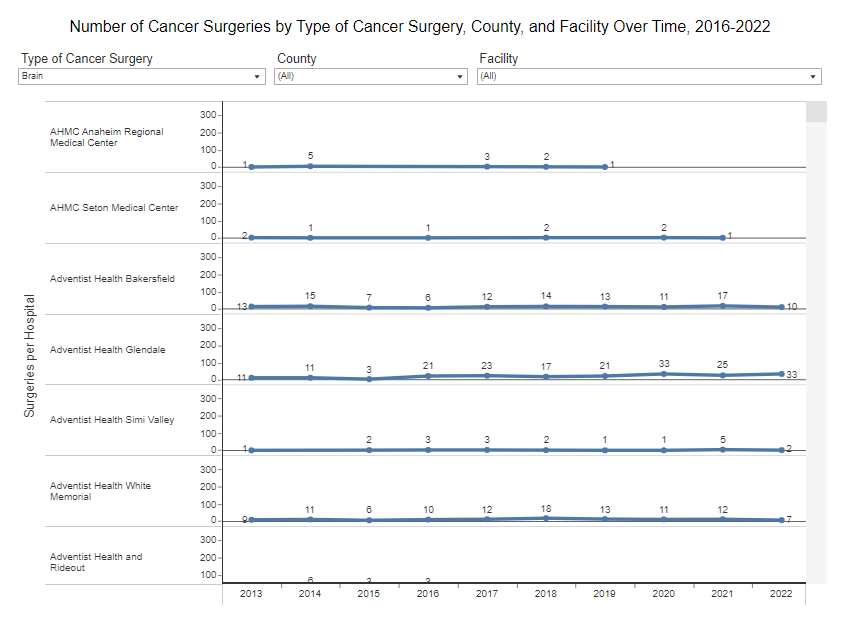 Volume of Cancer Surgeries Performed in California Hospitals
In 2022, almost 500,000 surgeries were performed in 291 California hospitals for 11 cancer types. Over 80 percent of these...
-
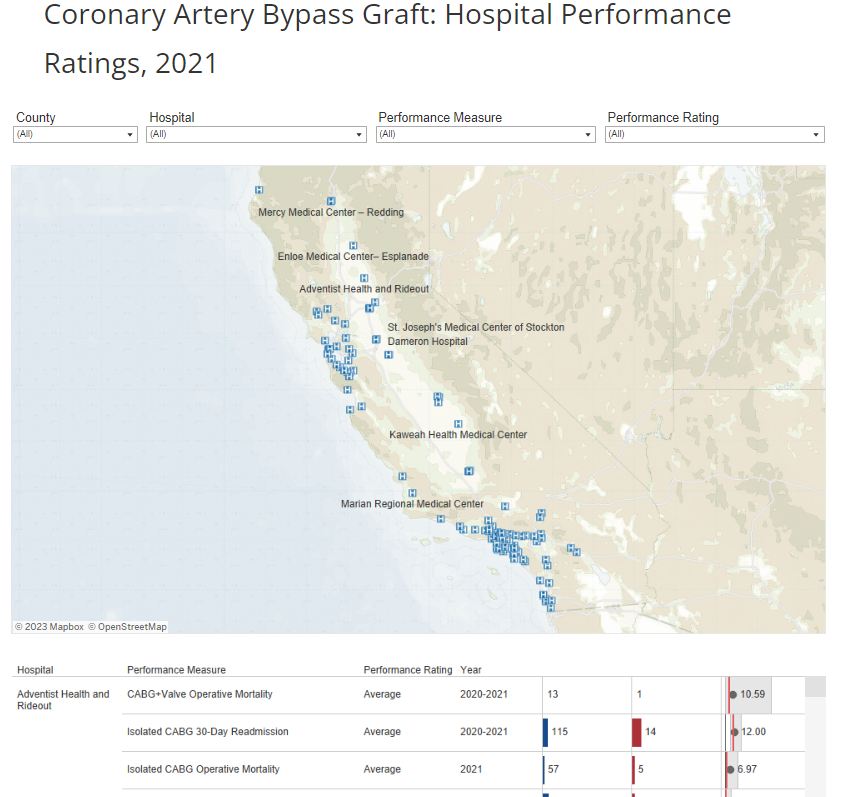 Coronary Artery Bypass Graft: Hospital Performance Ratings, 2021
120 state-licensed hospitals performed adult CABG surgery during 2020-2021. The statewide isolated CABG mortality rate for 2021 was 2.4 percent....
-
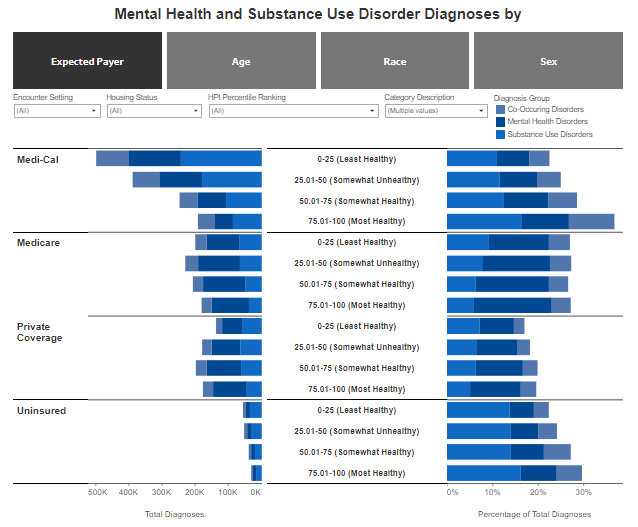 Mental and Behavioral Health Diagnoses in Emergency Department and Inpatient Discharges by Healthy Places Index Ranking
In 2020, 24 percent of diagnoses in the emergency department and inpatient settings were mental health disorders, substance use disorders,...