

Data
Latest Releases
-
 Healthcare Payments Data (HPD) Program Quarterly Newsletter June 2025
The Healthcare Payments Data Program Quarterly Newsletter provides programmatic updates and ongoing stakeholder engagement.
-
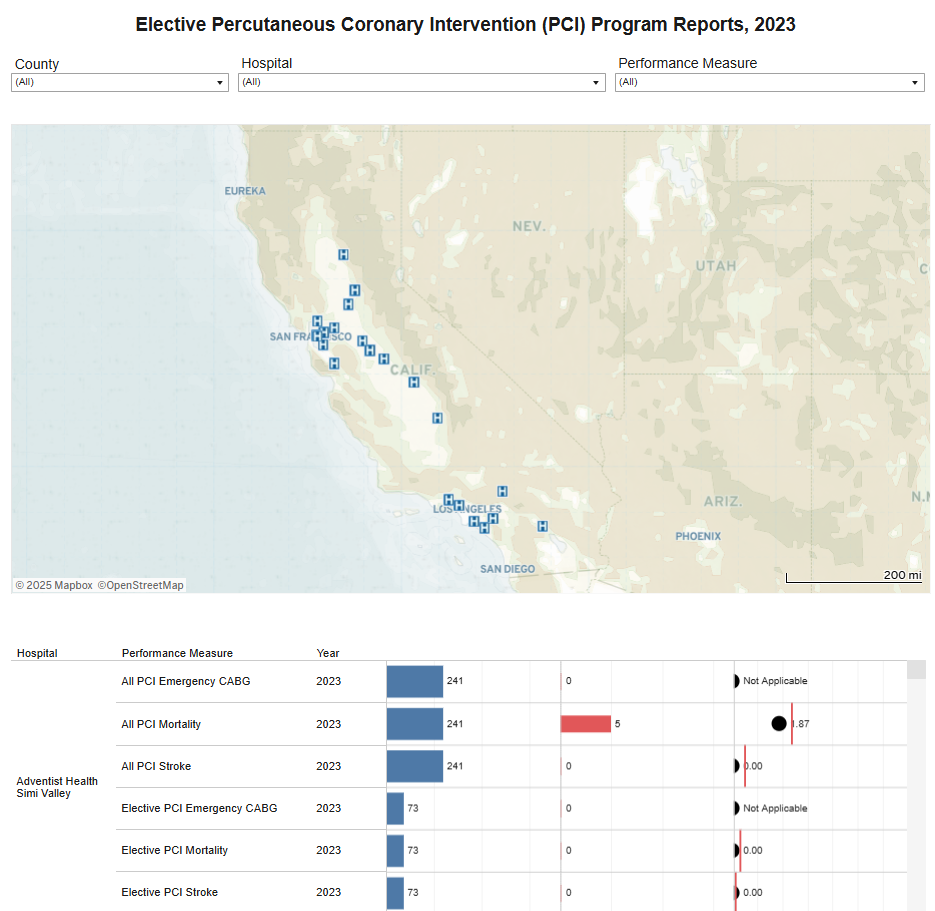 Elective Percutaneous Coronary Intervention (PCI) Program Report, 2023
This report provides risk-adjusted outcome measures for PCI mortality, post-PCI stroke, and post-PCI emergency coronary artery bypass graft (CABG) surgery.
Interactive Report -
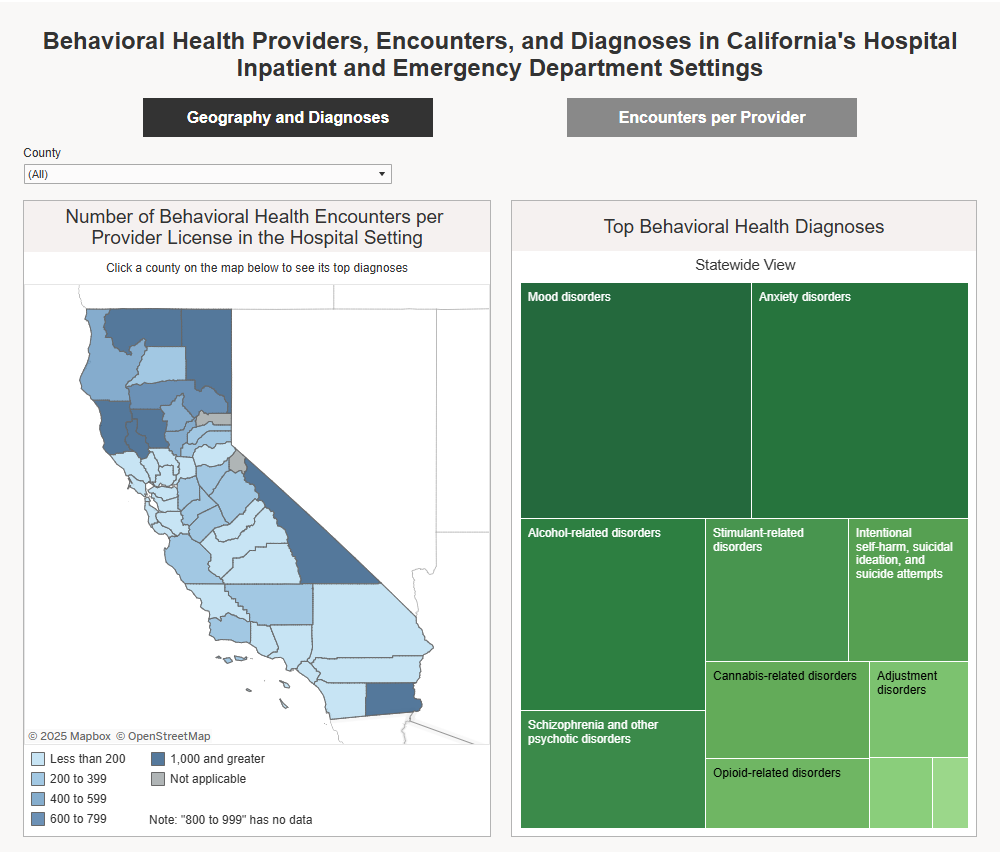 Behavioral Health Providers, Encounters, and Diagnoses in California’s Hospital Inpatient and Emergency Department Settings
The visualizations show disparities in the number of providers to patients for behavioral health services in inpatient and emergency department...
Interactive Report -
HPD Data Set Justification Grid
View the Custom Limited and Research Identifiable Justification Grid# Use the Justification Grid to select each variable and provide justification...
-
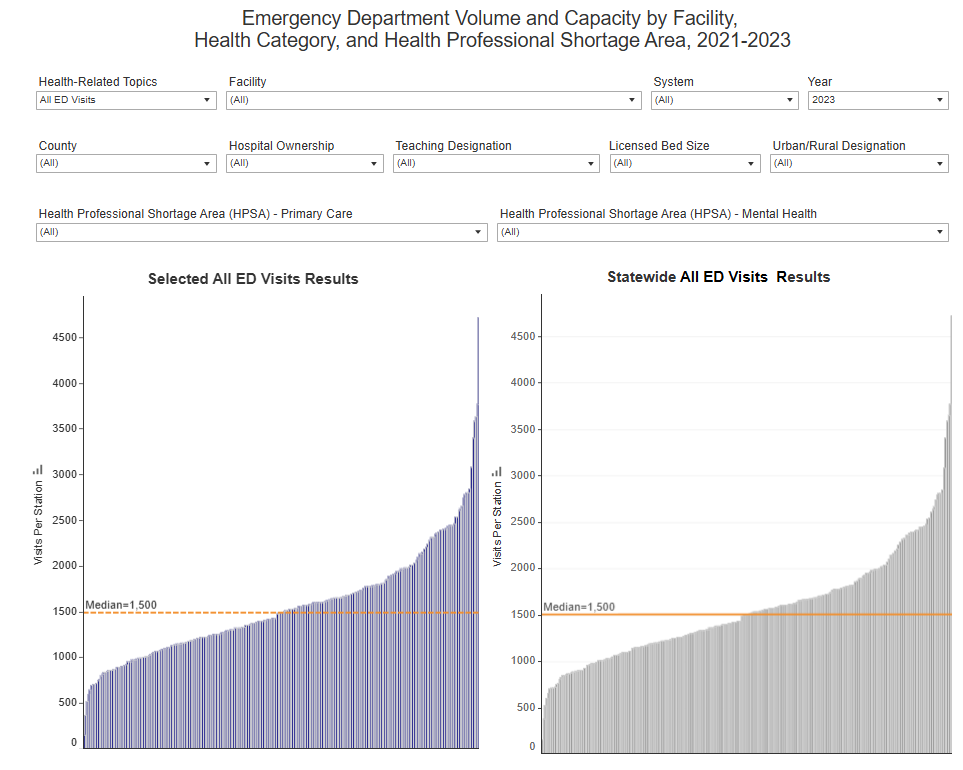 Emergency Department Volume and Capacity by Facility, Health Category and Health Professional Shortage Area
In 2021, the statewide median number of emergency department (ED) visits per ED treatment station was 1,270.
Interactive Report -
Hospital Supplier Diversity Plans
This webpage includes all submitted Hospital Supplier Diversity Plans. The information contained in the hospital’s plan on minority, women, LGBT,...
Report Finder -
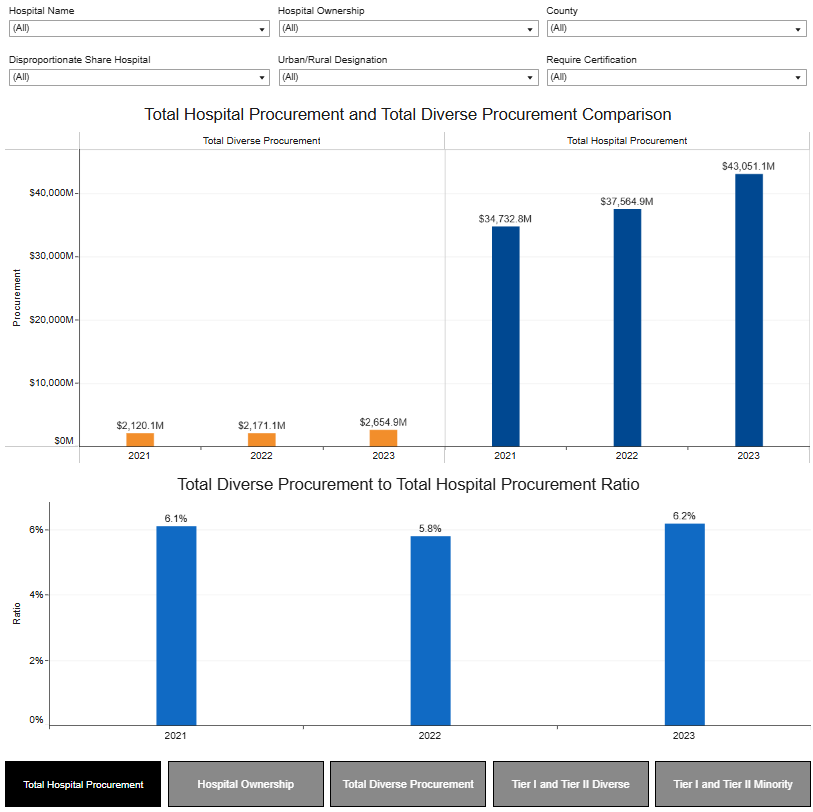 Supplier Diversity in California Hospital Procurements, 2021-2023
The total diverse procurement spend by individual hospitals reported between 2021 and 2023 increased by approximately 25%, $534.8 million, while...
Interactive Report -
Healthcare Payments Data (HPD) Program Quarterly Newsletter March 2025
The Department of Health Care Access and Information (HCAI) March HPD Program Quarterly Newsletter is designed to keep stakeholders informed...
-
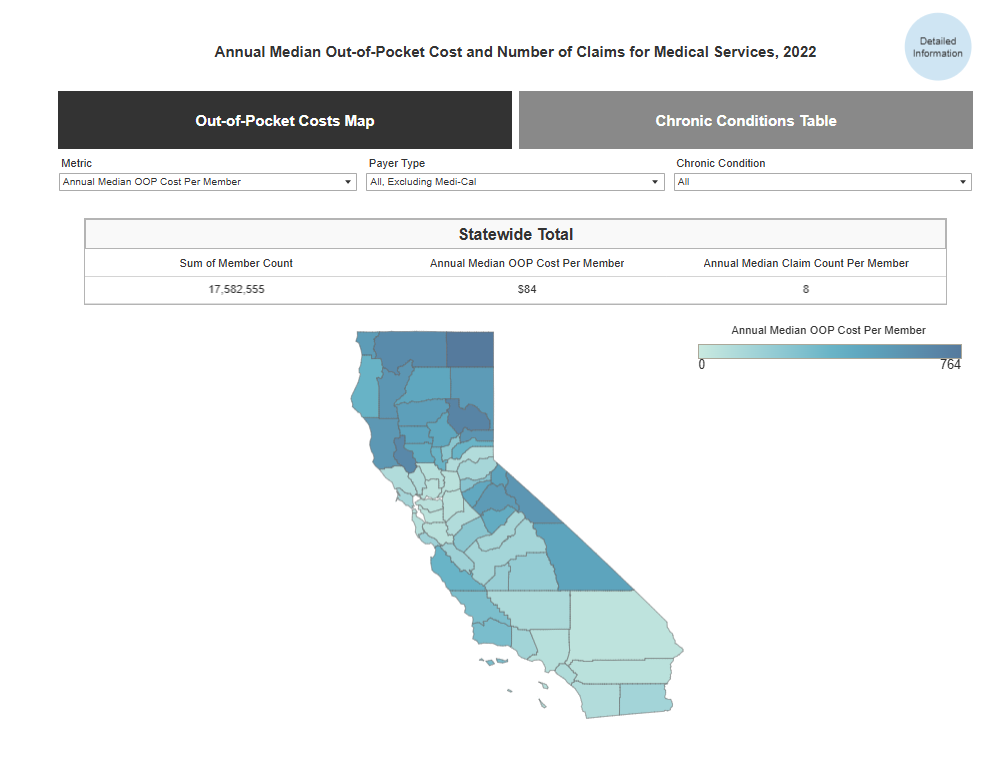 Healthcare Payments Data (HPD): Medical Out-of-Pocket Costs and Chronic Conditions, 2022
Californians with one or more chronic conditions had significantly higher out-of-pocket costs than those with no chronic conditions – a...
Interactive Report -
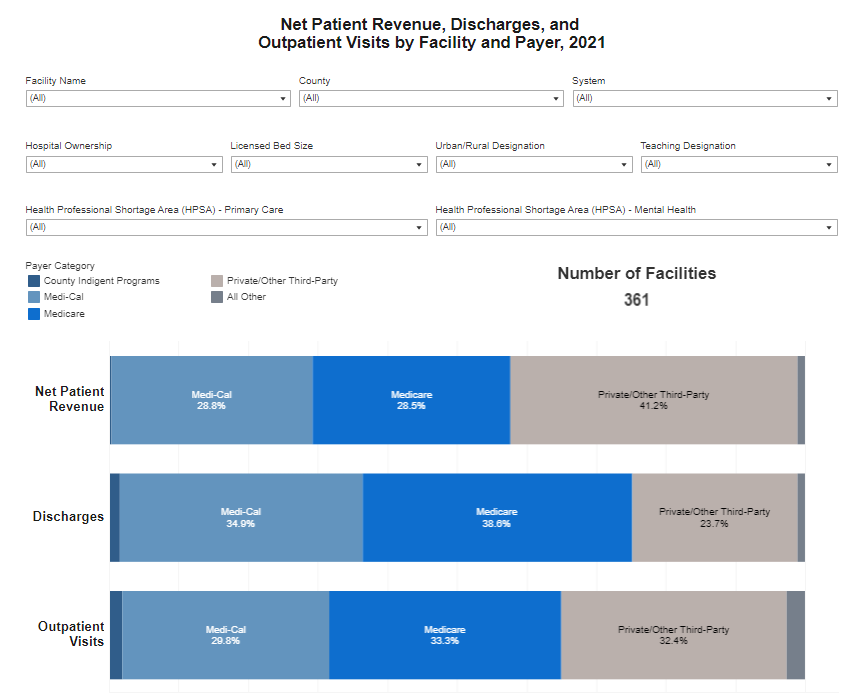 Net Patient Revenue, Discharges, and Outpatient Visits by Payer and Facility
In 2021, Private/Other Third-Party payers were the largest source of net patient revenue for California healthcare facilities (41.2 percent), while...
Interactive Report