

Data
Latest Releases
-
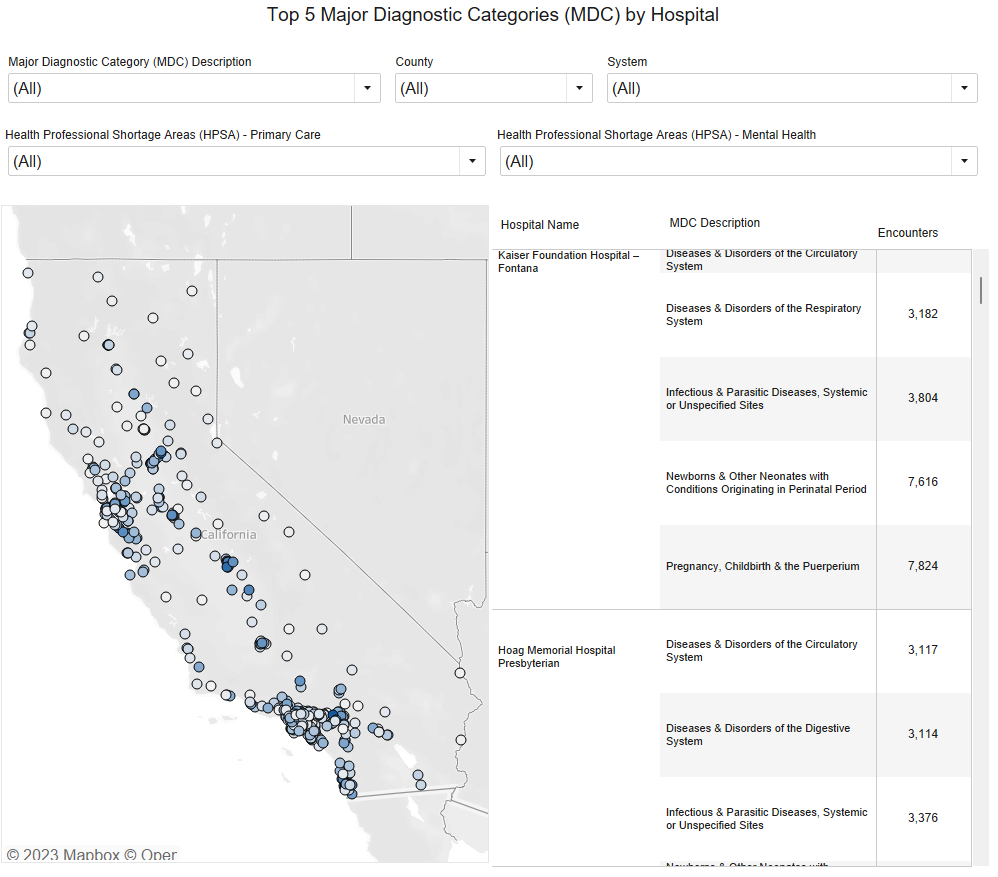 Top Five Major Diagnostic Categories (MDC) for California Hospitals
The Top Five MDCs for each hospital were identified from the number of encounters for each MDC from the Patient...
Interactive Report -
 Read the Health Care Payments Data Program Quarterly Newsletter for December 2023
Read the Healthcare Payments Data Program's Quarterly Newsletter for December 2023.
-
Data
-
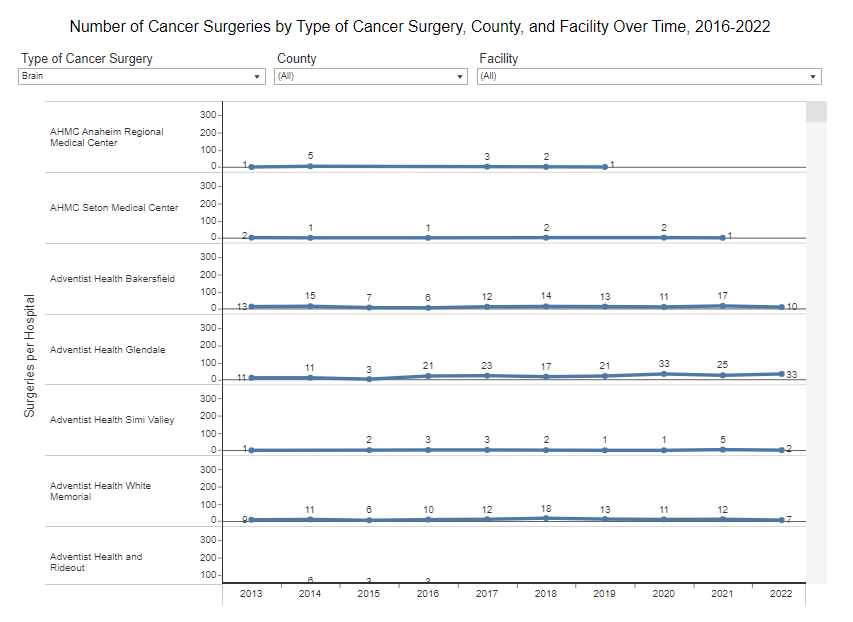 Volume of Cancer Surgeries Performed in California Hospitals
In 2022, almost 500,000 surgeries were performed in 291 California hospitals for 11 cancer types. Over 80 percent of these...
Interactive Report -
 California’s Health Workforce Education Pathways
Initial and Highest education levels differ significantly across Race & Ethnicity groups. Nearly 50 percent of White health professionals achieve...
Interactive Report -
 California’s Registered Nurse Education Pathways
The percentage of Registered Nurses choosing the Bachelor’s degree (BSN) pathway to licensure has increased substantially over time and is...
Interactive Report -
 Social Drivers of Health (SDoH) and Preventable Hospitalization Rates
In 2021, 13.6 percent of Black Californians’ hospital stays were potentially preventable, higher than any other racial/ethnic group's and nearly...
Interactive Report -
Patient-Level Data Modifications
What Are Patient-Level Data Modifications and Why Are They Allowed?# Data Type Key:AS – Ambulatory Surgery Center DataED – Emergency...
-
Read the Health Care Payments Data Program Quarterly Newsletter for September 2023
Get the latest programmatic updates, upcoming meeting information and more.
-
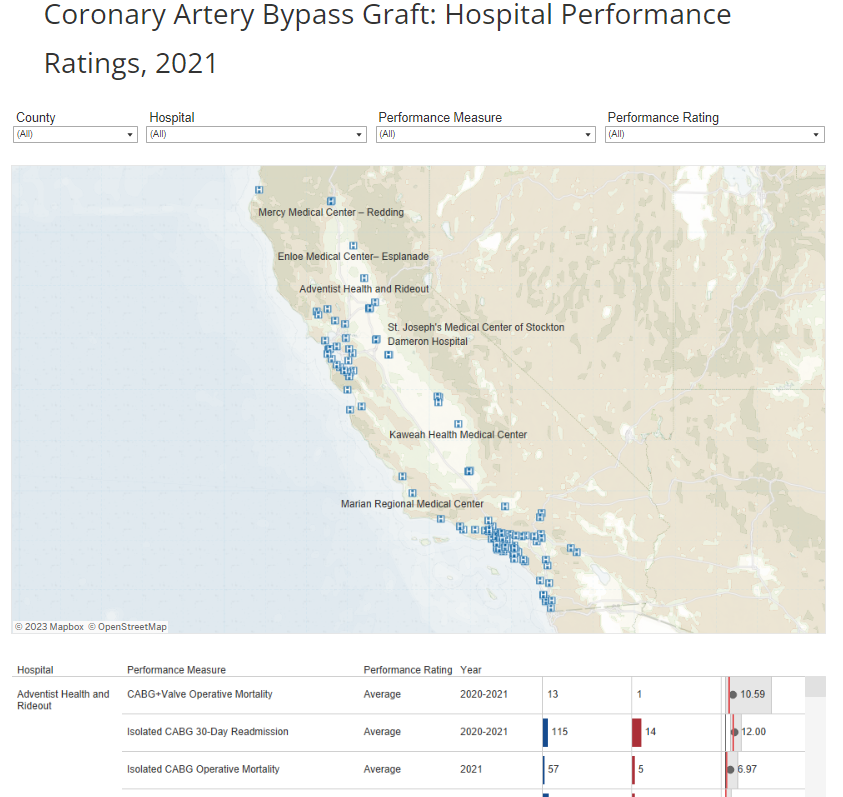 Coronary Artery Bypass Graft: Hospital Performance Ratings, 2021
120 state-licensed hospitals performed adult CABG surgery during 2020-2021. The statewide isolated CABG mortality rate for 2021 was 2.4 percent....
Interactive Report