

Featured Releases
Displaying 41-50 of 76 Visualizations
-
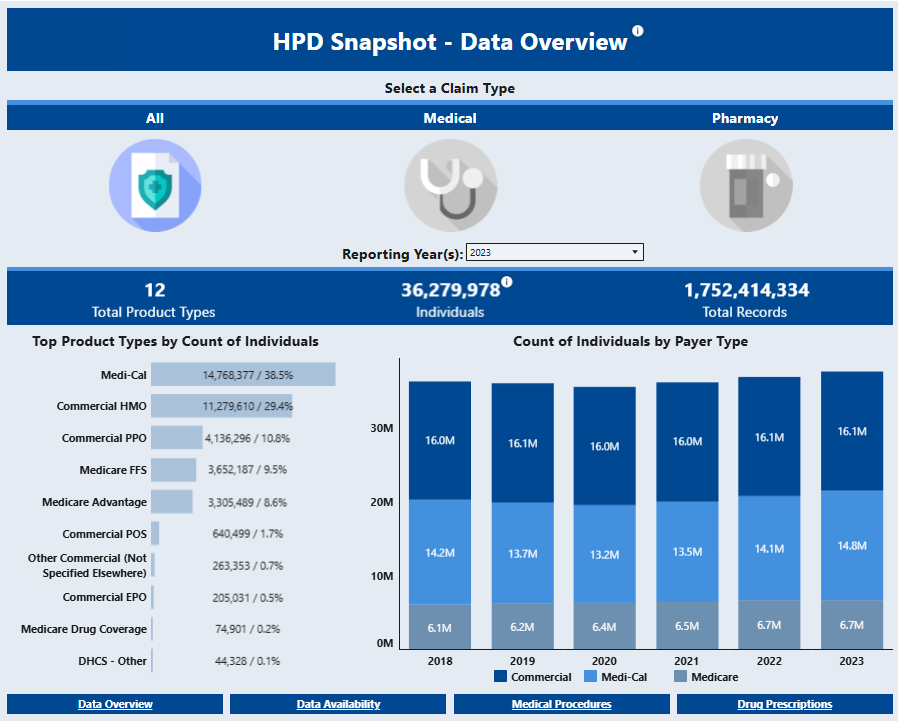 Healthcare Payments Data (HPD) Snapshot
Visualizations that allow users to explore how many Californians received coverage from each type of payer and service records generated.
-
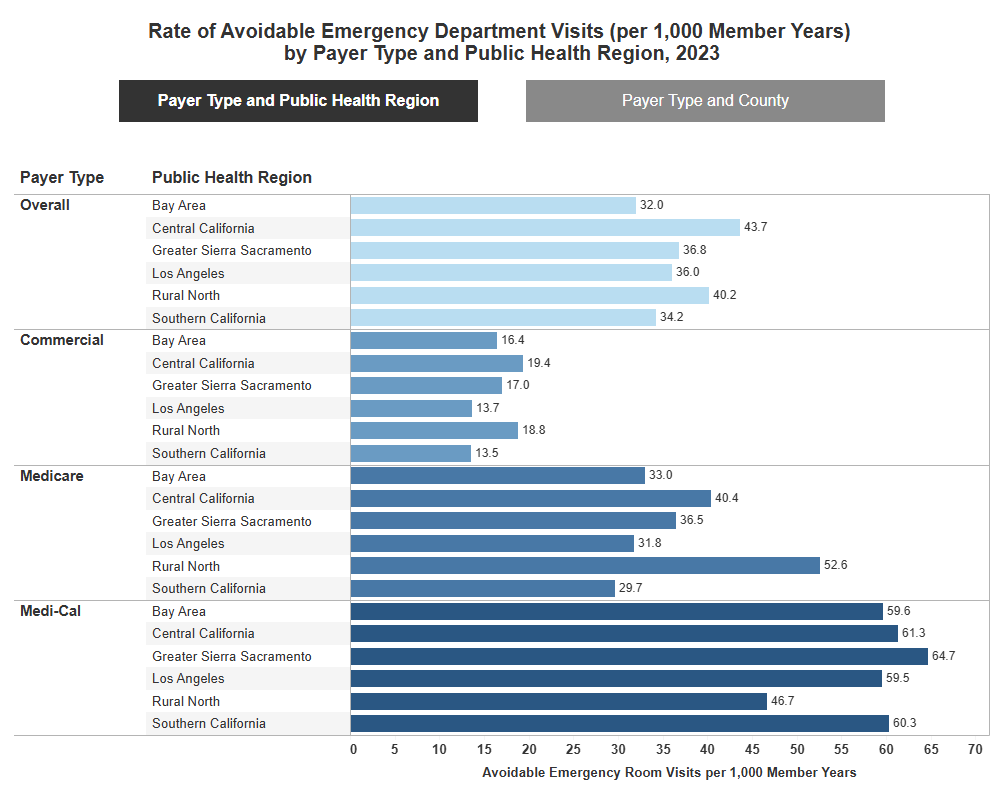 Data Brief: Avoidable Emergency Department Visits Vary Widely Across California
This report examines potentially avoidable ED visits across payer types and geographic areas of California using 2023 data.
-
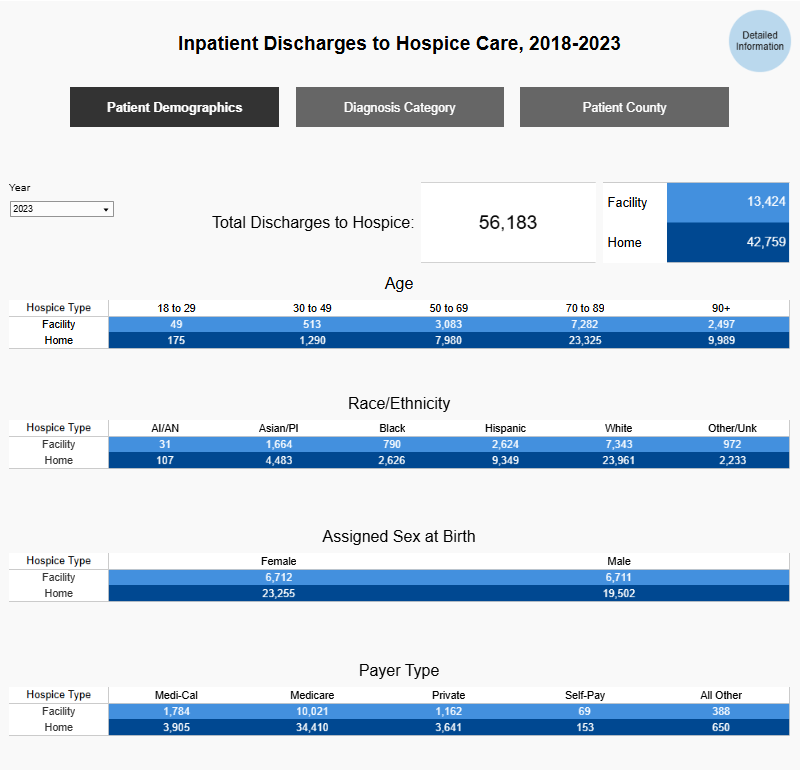 Inpatient Discharges to Home Hospice and Facility Hospice Care in California
This visualization looks at how patients use home-based hospice versus facility-based hospice services.
-
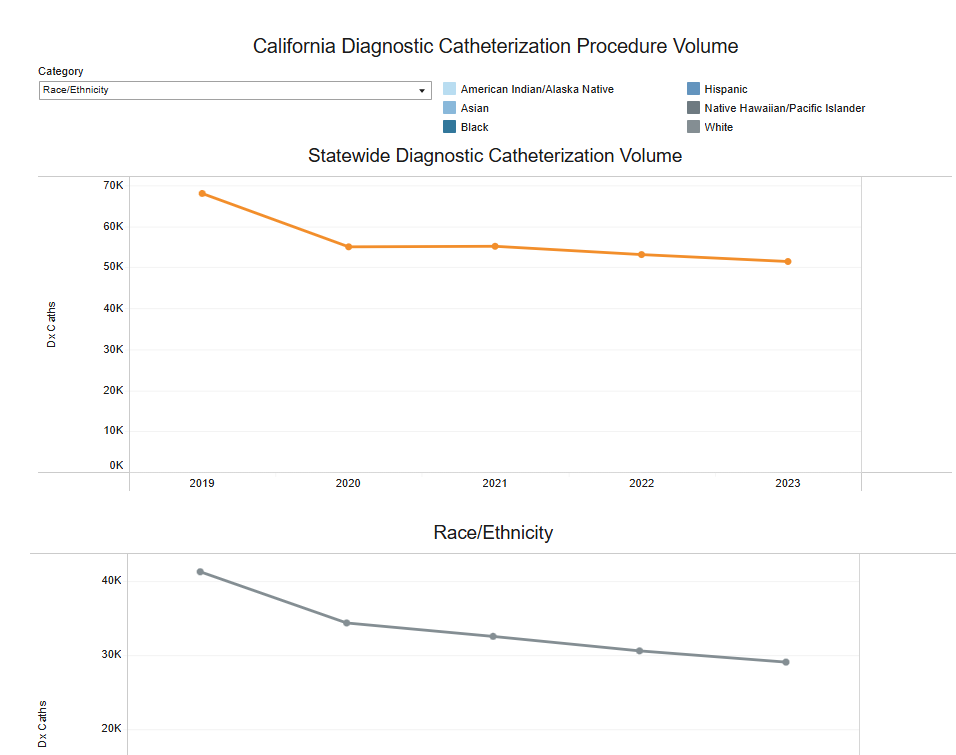 California Diagnostic Catheterization Volume by Sociodemographic Categories
This report evaluates the changes in the volume of DxCaths in California by sociodemographic categories over time.
-
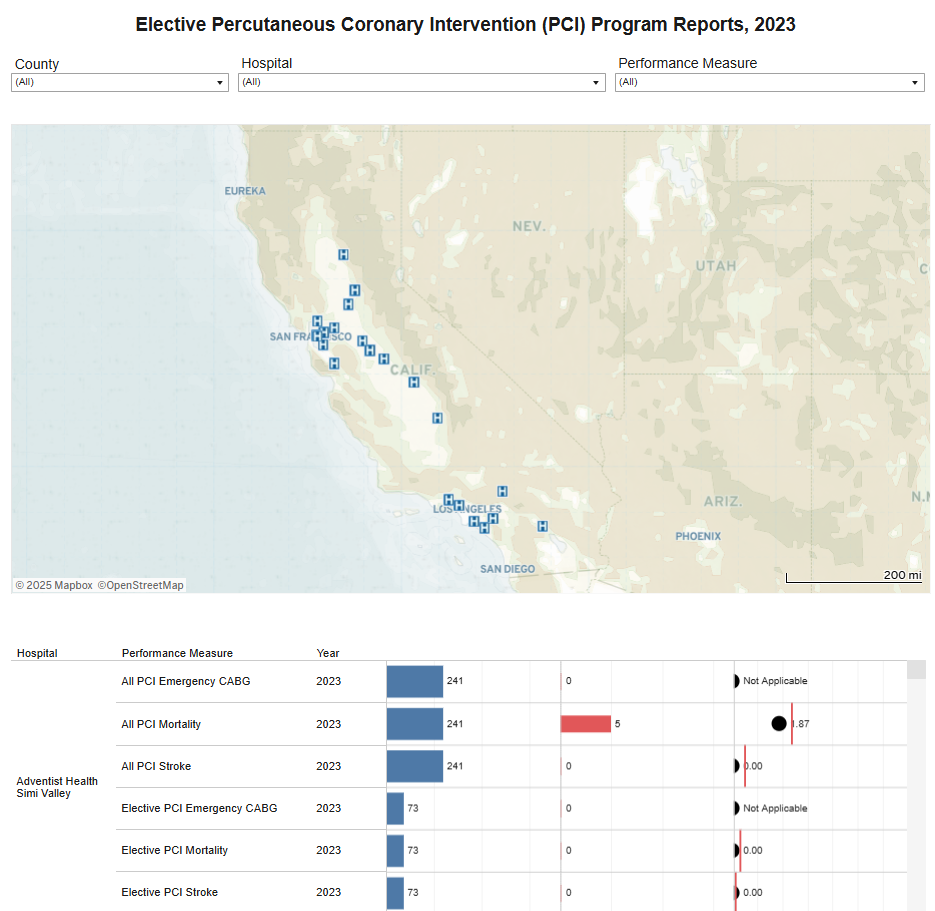 Elective Percutaneous Coronary Intervention (PCI) Program Report, 2023
This report provides risk-adjusted outcome measures for PCI mortality, post-PCI stroke, and post-PCI emergency coronary artery bypass graft (CABG) surgery.
-
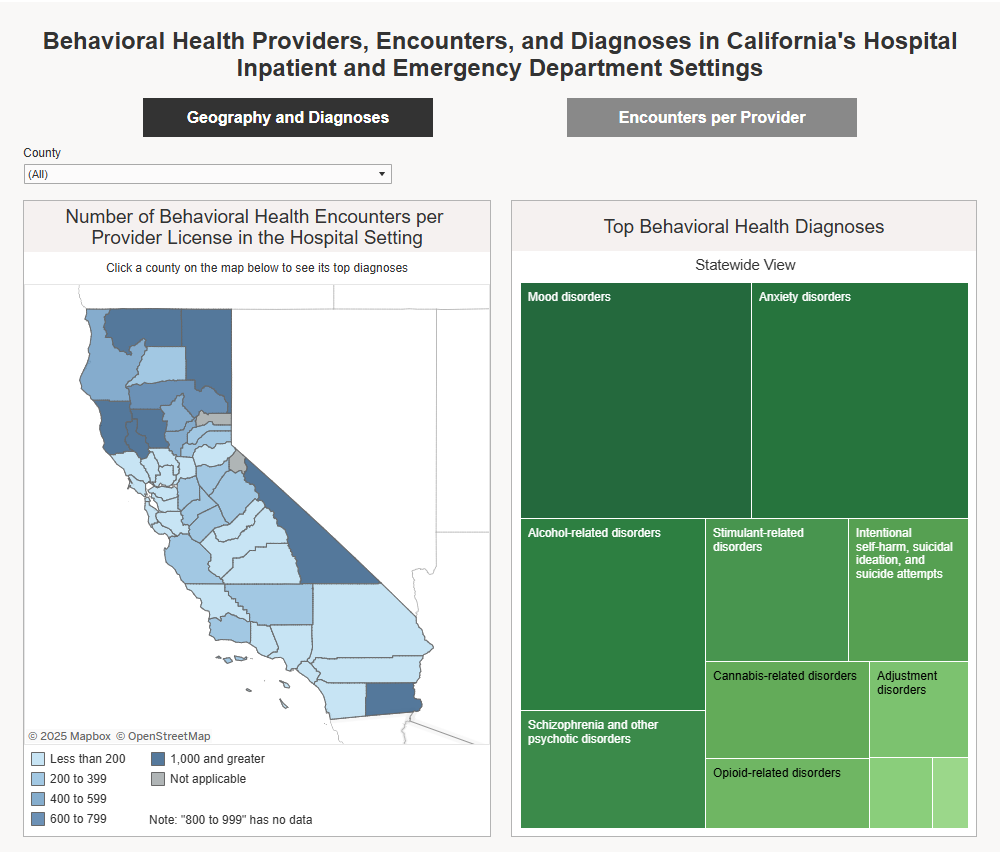 Behavioral Health Providers, Encounters, and Diagnoses in California’s Hospital Inpatient and Emergency Department Settings
The visualizations show disparities in the number of providers to patients for behavioral health services in inpatient and emergency department...
-
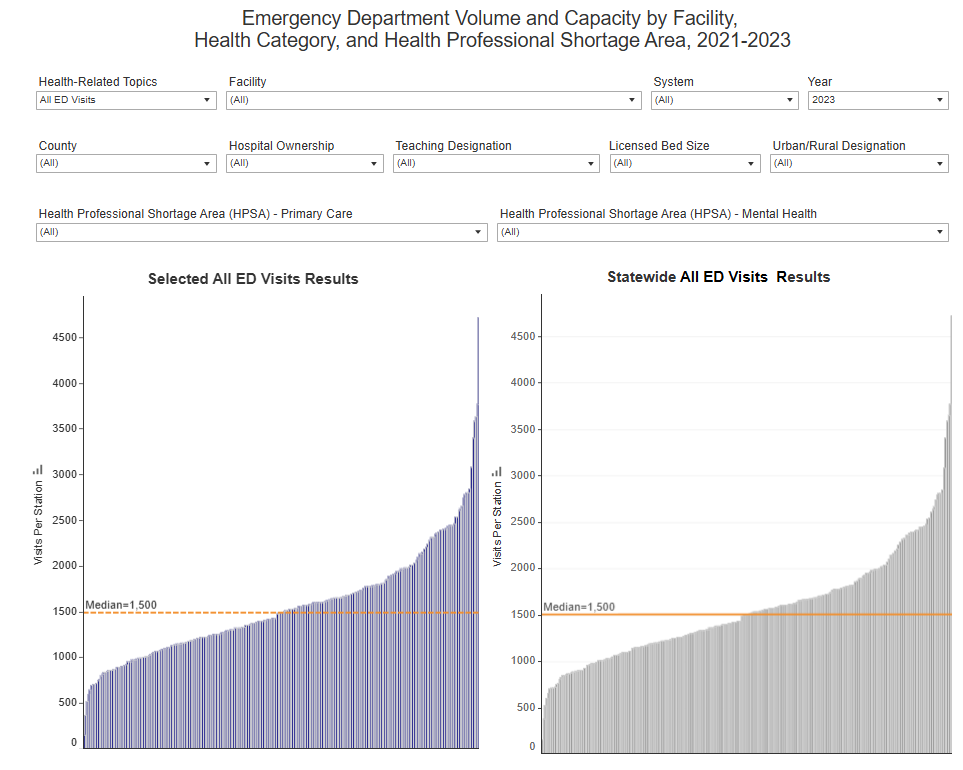 Emergency Department Volume and Capacity by Facility, Health Category and Health Professional Shortage Area
In 2021, the statewide median number of emergency department (ED) visits per ED treatment station was 1,270.
-
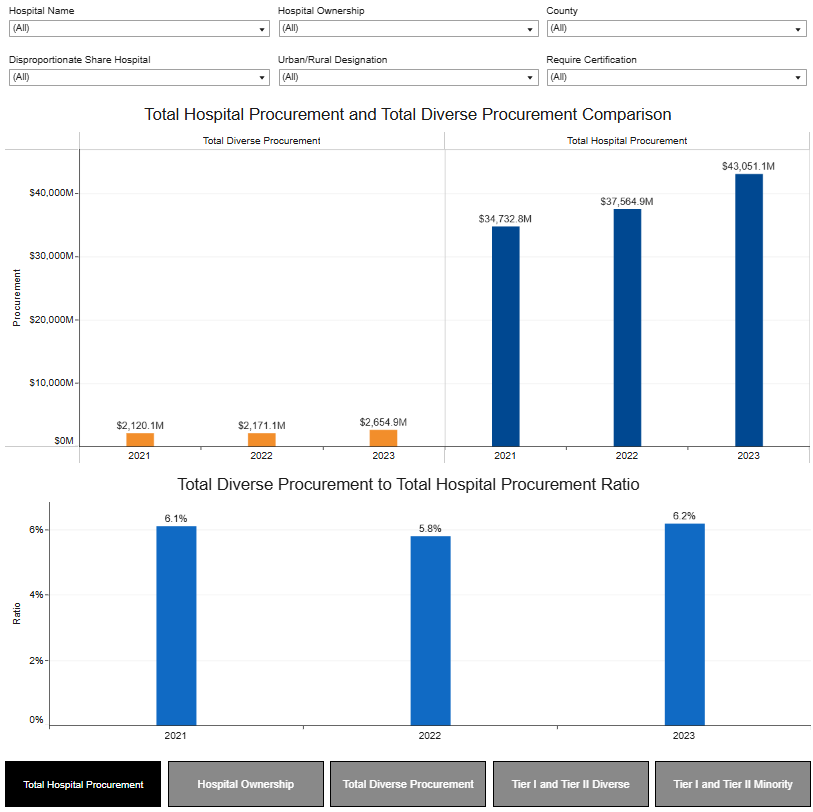 Supplier Diversity in California Hospital Procurements, 2021-2023
The total diverse procurement spend by individual hospitals reported between 2021 and 2023 increased by approximately 25%, $534.8 million, while...
-
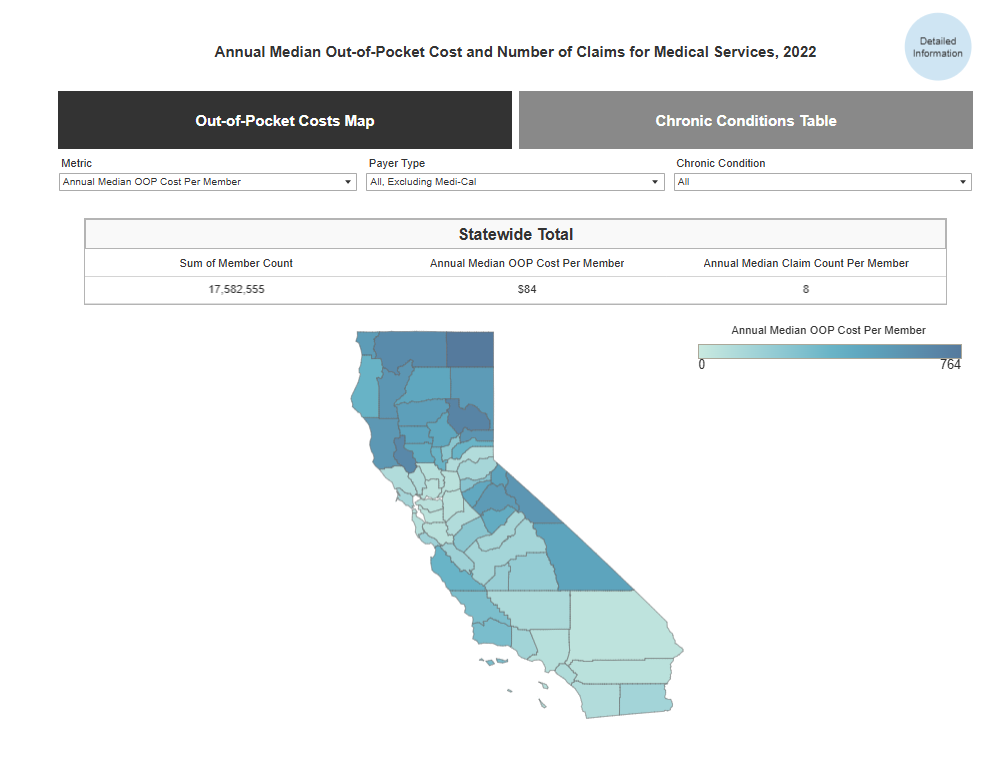 Healthcare Payments Data (HPD): Medical Out-of-Pocket Costs and Chronic Conditions, 2022
Californians with one or more chronic conditions had significantly higher out-of-pocket costs than those with no chronic conditions – a...
-
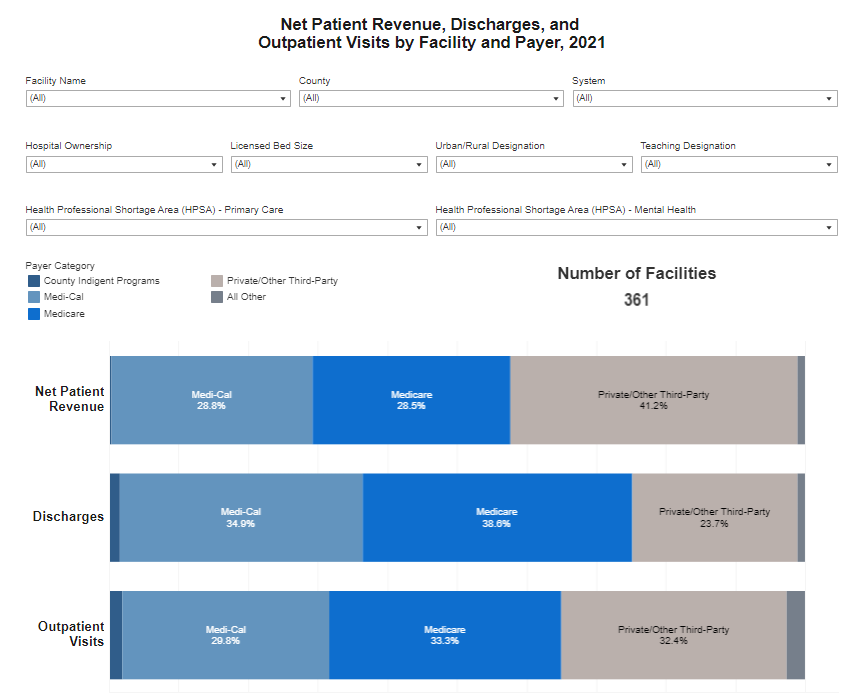 Net Patient Revenue, Discharges, and Outpatient Visits by Payer and Facility
In 2021, Private/Other Third-Party payers were the largest source of net patient revenue for California healthcare facilities (41.2 percent), while...